## Heatmap: R1-Qwen Performance on Various Datasets
### Overview
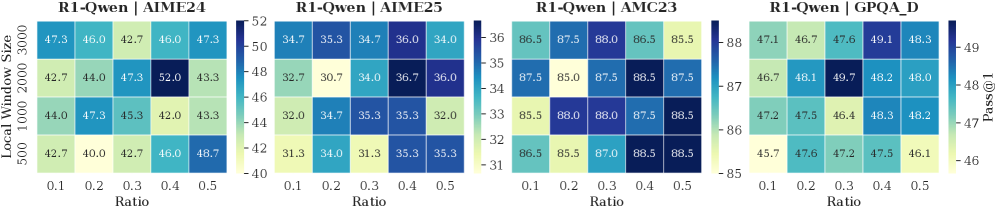
The image presents four heatmaps, each displaying the performance of the R1-Qwen model on a different dataset (AIME24, AIME25, AMC23, and GPQA_D). The heatmaps visualize the "Pass@1" metric across different "Local Window Sizes" and "Ratio" values. The color intensity represents the Pass@1 score, with darker blues indicating higher scores and lighter yellows indicating lower scores.
### Components/Axes
* **Titles:** Each heatmap has a title in the format "R1-Qwen | [Dataset Name]". The datasets are AIME24, AIME25, AMC23, and GPQA_D.
* **X-axis:** "Ratio" with values 0.1, 0.2, 0.3, 0.4, and 0.5.
* **Y-axis:** "Local Window Size" with values 500, 1000, 2000, and 3000.
* **Color Scale (Legend):** Located between the AIME25 and AMC23 heatmaps, and between the AMC23 and GPQA_D heatmaps.
* The color scale represents the "Pass@1" metric.
* For AIME24 and AIME25: ranges from 40 (yellow) to 52 (dark blue) and 31 (yellow) to 36 (dark blue) respectively.
* For AMC23: ranges from 85 (yellow) to 88 (dark blue).
* For GPQA_D: ranges from 46 (yellow) to 49 (dark blue).
### Detailed Analysis
**Heatmap 1: R1-Qwen | AIME24**
| Local Window Size | Ratio 0.1 | Ratio 0.2 | Ratio 0.3 | Ratio 0.4 | Ratio 0.5 |
| ----------------- | --------- | --------- | --------- | --------- | --------- |
| 500 | 42.7 | 40.0 | 42.7 | 46.0 | 48.7 |
| 1000 | 44.0 | 47.3 | 45.3 | 42.0 | 43.3 |
| 2000 | 42.7 | 44.0 | 47.3 | 52.0 | 43.3 |
| 3000 | 47.3 | 46.0 | 42.7 | 46.0 | 47.3 |
* The highest Pass@1 score (52.0) is achieved with a Local Window Size of 2000 and a Ratio of 0.4.
* The lowest Pass@1 score (40.0) is achieved with a Local Window Size of 500 and a Ratio of 0.2.
**Heatmap 2: R1-Qwen | AIME25**
| Local Window Size | Ratio 0.1 | Ratio 0.2 | Ratio 0.3 | Ratio 0.4 | Ratio 0.5 |
| ----------------- | --------- | --------- | --------- | --------- | --------- |
| 500 | 31.3 | 34.0 | 31.3 | 35.3 | 35.3 |
| 1000 | 32.0 | 34.7 | 35.3 | 35.3 | 32.0 |
| 2000 | 32.7 | 30.7 | 34.0 | 36.7 | 36.0 |
| 3000 | 34.7 | 35.3 | 34.7 | 36.0 | 34.0 |
* The highest Pass@1 score (36.7) is achieved with a Local Window Size of 2000 and a Ratio of 0.4.
* The lowest Pass@1 score (30.7) is achieved with a Local Window Size of 2000 and a Ratio of 0.2.
**Heatmap 3: R1-Qwen | AMC23**
| Local Window Size | Ratio 0.1 | Ratio 0.2 | Ratio 0.3 | Ratio 0.4 | Ratio 0.5 |
| ----------------- | --------- | --------- | --------- | --------- | --------- |
| 500 | 86.5 | 85.5 | 87.0 | 88.5 | 88.5 |
| 1000 | 85.5 | 88.0 | 88.0 | 87.5 | 88.5 |
| 2000 | 87.5 | 85.0 | 87.5 | 88.5 | 87.5 |
| 3000 | 86.5 | 87.5 | 88.0 | 86.5 | 85.5 |
* The highest Pass@1 score (88.5) is achieved with a Local Window Size of 500 and a Ratio of 0.4, a Local Window Size of 500 and a Ratio of 0.5, a Local Window Size of 1000 and a Ratio of 0.5, and a Local Window Size of 2000 and a Ratio of 0.4.
* The lowest Pass@1 score (85.0) is achieved with a Local Window Size of 2000 and a Ratio of 0.2.
**Heatmap 4: R1-Qwen | GPQA_D**
| Local Window Size | Ratio 0.1 | Ratio 0.2 | Ratio 0.3 | Ratio 0.4 | Ratio 0.5 |
| ----------------- | --------- | --------- | --------- | --------- | --------- |
| 500 | 45.7 | 47.6 | 47.2 | 47.5 | 46.1 |
| 1000 | 47.2 | 47.5 | 46.4 | 48.3 | 48.2 |
| 2000 | 46.7 | 48.1 | 49.7 | 48.2 | 48.0 |
| 3000 | 47.1 | 46.7 | 47.6 | 49.1 | 48.3 |
* The highest Pass@1 score (49.7) is achieved with a Local Window Size of 2000 and a Ratio of 0.3.
* The lowest Pass@1 score (45.7) is achieved with a Local Window Size of 500 and a Ratio of 0.1.
### Key Observations
* The AMC23 dataset consistently yields the highest Pass@1 scores across all configurations, while AIME25 yields the lowest.
* The optimal "Ratio" and "Local Window Size" vary depending on the dataset.
* For AIME24, a Local Window Size of 2000 and a Ratio of 0.4 results in the best performance.
* For AIME25, a Local Window Size of 2000 and a Ratio of 0.4 results in the best performance.
* For AMC23, multiple configurations achieve the highest score (88.5).
* For GPQA_D, a Local Window Size of 2000 and a Ratio of 0.3 results in the best performance.
### Interpretation
The heatmaps illustrate the sensitivity of the R1-Qwen model's performance to different hyperparameter settings ("Ratio" and "Local Window Size") across various datasets. The results suggest that the optimal configuration is dataset-dependent, highlighting the importance of tuning these parameters for each specific task. The consistently high performance on the AMC23 dataset indicates that the model is particularly well-suited for this type of data, while the lower scores on AIME25 suggest potential challenges in processing that dataset. The data suggests that a local window size of 2000 is generally a good choice.