## Heatmap Series: R1-Qwen Model Performance Across Benchmarks
### Overview
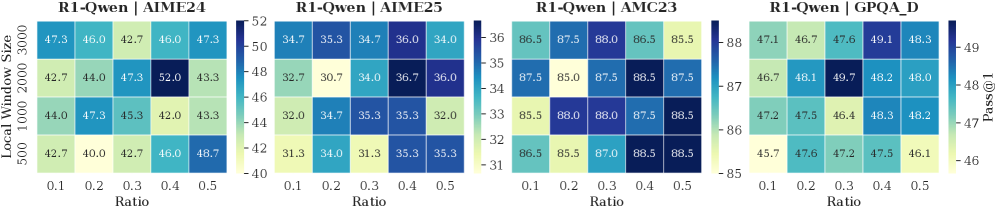
The image displays four horizontally arranged heatmaps, each visualizing the performance (Pass@1 metric) of a model labeled "R1-Qwen" on a different benchmark. Performance is plotted as a function of two hyperparameters: "Local Window Size" (y-axis) and "Ratio" (x-axis). The color intensity in each cell represents the Pass@1 score, with a dedicated color bar scale for each chart.
### Components/Axes
**Common Elements (All Four Charts):**
* **Y-Axis Label:** `Local Window Size` (Position: Left side, rotated vertically)
* **Y-Axis Ticks (from bottom to top):** `500`, `1000`, `2000`, `3000`
* **X-Axis Label:** `Ratio` (Position: Bottom center)
* **X-Axis Ticks (from left to right):** `0.1`, `0.2`, `0.3`, `0.4`, `0.5`
* **Color Scale:** A vertical gradient bar to the right of each heatmap, mapping cell color to a numerical Pass@1 value. The scale range varies per chart.
* **Metric Label:** `Pass@1` (Position: Far right, next to the color bar of the fourth chart).
**Individual Chart Titles (Position: Centered above each heatmap):**
1. `R1-Qwen | AIME'24`
2. `R1-Qwen | AIME'25`
3. `R1-Qwen | AMC23`
4. `R1-Qwen | GPQA_D`
### Detailed Analysis
**Chart 1: R1-Qwen | AIME'24**
* **Color Bar Scale:** Ranges from ~40 (light yellow) to ~52 (dark blue).
* **Data Grid (Pass@1 scores, rows=Window Size, columns=Ratio):**
| Window Size | Ratio 0.1 | Ratio 0.2 | Ratio 0.3 | Ratio 0.4 | Ratio 0.5 |
| :--- | :--- | :--- | :--- | :--- | :--- |
| **3000** | 47.3 | 46.0 | 42.7 | 46.0 | 47.3 |
| **2000** | 42.7 | 44.0 | 47.3 | **52.0** | 43.3 |
| **1000** | 44.0 | 47.3 | 45.3 | 42.0 | 43.3 |
| **500** | 42.7 | 40.0 | 42.7 | 46.0 | 48.7 |
* **Trend Verification:** No single monotonic trend across all series. The highest value (52.0) is an isolated peak at (Window=2000, Ratio=0.4). Performance at Window=500 generally increases with Ratio. Performance at Window=3000 is relatively stable.
**Chart 2: R1-Qwen | AIME'25**
* **Color Bar Scale:** Ranges from ~31 (light yellow) to ~36 (dark blue).
* **Data Grid:**
| Window Size | Ratio 0.1 | Ratio 0.2 | Ratio 0.3 | Ratio 0.4 | Ratio 0.5 |
| :--- | :--- | :--- | :--- | :--- | :--- |
| **3000** | 34.7 | 35.3 | 34.7 | 36.0 | 34.0 |
| **2000** | 32.7 | 30.7 | 34.0 | 36.7 | 36.0 |
| **1000** | 32.0 | 34.7 | 35.3 | 35.3 | 32.0 |
| **500** | 31.3 | 34.0 | 31.3 | 35.3 | 35.3 |
* **Trend Verification:** Similar to AIME'24, the peak (36.7) occurs at (Window=2000, Ratio=0.4). The lowest values are clustered in the lower-left region (smaller window, smaller ratio).
**Chart 3: R1-Qwen | AMC23**
* **Color Bar Scale:** Ranges from ~85 (light yellow) to ~88 (dark blue). Note the significantly higher absolute values compared to other charts.
* **Data Grid:**
| Window Size | Ratio 0.1 | Ratio 0.2 | Ratio 0.3 | Ratio 0.4 | Ratio 0.5 |
| :--- | :--- | :--- | :--- | :--- | :--- |
| **3000** | 86.5 | 87.5 | 88.0 | 86.5 | 85.5 |
| **2000** | 87.5 | 85.0 | 87.5 | 88.5 | 87.5 |
| **1000** | 85.5 | 88.0 | 88.0 | 87.5 | 88.5 |
| **500** | 86.5 | 85.5 | 87.0 | 88.5 | 88.5 |
* **Trend Verification:** Performance is uniformly high (85.0-88.5). The highest values (88.5) appear at multiple points: (Window=2000, Ratio=0.4), (Window=1000, Ratio=0.5), and (Window=500, Ratios 0.4 & 0.5). There is no strong, consistent directional trend.
**Chart 4: R1-Qwen | GPQA_D**
* **Color Bar Scale:** Ranges from ~46 (light yellow) to ~49 (dark blue).
* **Data Grid:**
| Window Size | Ratio 0.1 | Ratio 0.2 | Ratio 0.3 | Ratio 0.4 | Ratio 0.5 |
| :--- | :--- | :--- | :--- | :--- | :--- |
| **3000** | 47.1 | 46.7 | 47.6 | 49.1 | 48.3 |
| **2000** | 46.7 | 48.1 | **49.7** | 48.2 | 48.0 |
| **1000** | 47.2 | 47.5 | 46.4 | 48.3 | 48.2 |
| **500** | 45.7 | 47.6 | 47.2 | 47.5 | 46.1 |
* **Trend Verification:** The global peak (49.7) is at (Window=2000, Ratio=0.3). The series for Window=3000 shows a general upward trend with increasing Ratio. The series for Window=500 is more erratic.
### Key Observations
1. **Consistent Peak Location:** In three of the four benchmarks (AIME'24, AIME'25, GPQA_D), the highest performance is achieved with a **Local Window Size of 2000**. The optimal Ratio varies (0.4 for AIME benchmarks, 0.3 for GPQA_D).
2. **Benchmark Difficulty:** The absolute Pass@1 scores vary dramatically by benchmark. **AMC23** yields the highest scores (85-88), suggesting it is the easiest for this model. **AIME'25** yields the lowest scores (31-37), indicating it is the most challenging.
3. **Parameter Sensitivity:** Performance is sensitive to both hyperparameters, but not in a uniform way across tasks. The relationship is non-linear, with specific combinations (like 2000/0.4) creating performance peaks.
4. **Color Scale Deception:** Visually, the heatmaps look similar in color distribution, but the numerical scales are vastly different. Direct visual comparison of "darkness" between charts is misleading without referencing the specific color bar.
### Interpretation
This analysis provides a hyperparameter sensitivity study for the R1-Qwen model. The data suggests that model performance on reasoning benchmarks (AIME, AMC, GPQA) is not governed by simple "bigger is better" rules for window size or ratio. Instead, there exists a **sweet spot** in the configuration space, particularly around a window size of 2000 tokens.
The stark difference in score ranges between AMC23 (~87) and AIME'25 (~34) highlights the varying difficulty and possibly the different skill sets tested by these benchmarks. The model's strong performance on AMC23 indicates solid foundational problem-solving, while the lower scores on AIME (especially the 2025 version) suggest challenges with more advanced or novel competition problems.
For a practitioner, this chart is a guide for tuning: starting with a window size of 2000 and exploring ratios between 0.3 and 0.4 would be a prudent strategy for maximizing performance on similar tasks. The lack of a universal trend underscores the importance of benchmark-specific tuning.