## Scatter Plots: Load vs. Work Index, Categorized by Day/Type
### Overview
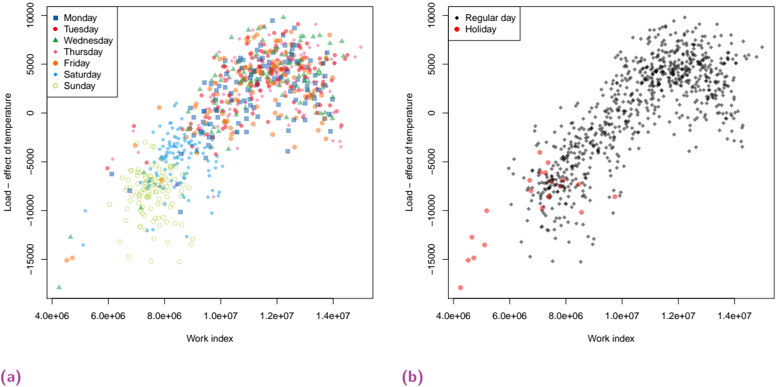
The image presents two scatter plots, labeled (a) and (b). Plot (a) displays the relationship between "Load - effect of temperature" (y-axis) and "Work index" (x-axis), with data points color-coded by day of the week. Plot (b) shows the same relationship, but categorizes data points as either "Regular day" or "Holiday". Both plots share the same axes scales.
### Components/Axes
* **X-axis:** "Work index", ranging from approximately 4.0e+06 to 1.4e+07.
* **Y-axis:** "Load - effect of temperature", ranging from approximately -15000 to 10000.
* **Plot (a) Legend:**
* Blue Square: Monday
* Orange Circle: Tuesday
* Green Triangle: Wednesday
* Red Diamond: Thursday
* Purple Cross: Friday
* Yellow Dot: Saturday
* Brown Plus: Sunday
* **Plot (b) Legend:**
* Black Dot: Regular day
* Red Diamond: Holiday
### Detailed Analysis or Content Details
**Plot (a): Load vs. Work Index by Day of the Week**
* **Monday (Blue Squares):** Data points are clustered between Work Index values of 6.0e+06 and 1.2e+07, with Load values generally between -5000 and 5000. There's a slight upward trend as Work Index increases.
* **Tuesday (Orange Circles):** Similar to Monday, clustered between 6.0e+06 and 1.2e+07, but with a wider spread in Load values, extending to approximately 8000.
* **Wednesday (Green Triangles):** Data points are concentrated at lower Work Index values (around 4.5e+06) and negative Load values (between -10000 and -5000).
* **Thursday (Red Diamonds):** Shows a broad distribution, with points spanning the entire Work Index range and Load values from -15000 to 8000.
* **Friday (Purple Crosses):** Similar to Tuesday, clustered between 6.0e+06 and 1.2e+07, with Load values generally between -5000 and 5000.
* **Saturday (Yellow Dots):** Data points are concentrated at lower Work Index values (around 4.5e+06) and negative Load values (between -10000 and -5000).
* **Sunday (Brown Plus):** Data points are concentrated at lower Work Index values (around 4.5e+06) and negative Load values (between -10000 and -5000).
**Plot (b): Load vs. Work Index by Day Type**
* **Regular Day (Black Dots):** The majority of points are densely clustered, forming a roughly elliptical shape. The Work Index ranges from 4.0e+06 to 1.4e+07, and Load values range from -10000 to 5000.
* **Holiday (Red Diamonds):** Data points are concentrated at lower Work Index values (around 4.0e+06 to 6.0e+06) and negative Load values (between -15000 and -5000).
### Key Observations
* **Plot (a):** Weekdays (Monday, Tuesday, Thursday, Friday) exhibit a more dispersed pattern compared to the weekend days (Wednesday, Saturday, Sunday). Wednesday, Saturday, and Sunday show a strong concentration of data points at lower Work Index and negative Load values.
* **Plot (b):** Holidays are clearly associated with lower Work Index and more negative Load values compared to regular days.
* **Overall:** There appears to be a positive correlation between Work Index and Load, but this relationship is not linear and is influenced by the day of the week or day type.
### Interpretation
The data suggests that "Load - effect of temperature" is influenced by both the amount of "Work index" and the day of the week/day type. The higher the Work Index, the higher the Load tends to be, but this trend is modulated by whether it's a weekday versus a weekend or holiday.
The concentration of data points for Wednesday, Saturday, Sunday, and Holidays at lower Work Index and negative Load values indicates that these days are characterized by reduced work activity and potentially lower temperatures (given the "effect of temperature" component of the y-axis). The wider spread of data points for weekdays suggests more variability in work activity and temperature effects during those days.
The distinction between "Regular day" and "Holiday" in Plot (b) reinforces the idea that holidays are associated with significantly different work patterns and temperature-related load profiles. The clustering of holiday data at lower Work Index and negative Load suggests a substantial reduction in activity during these periods.
The plots provide insights into the relationship between work activity, temperature effects, and the resulting load, potentially useful for resource planning, energy management, or understanding system behavior under different conditions.