## Line Chart: Accuracy of judging preferred and undesirable outputs
### Overview
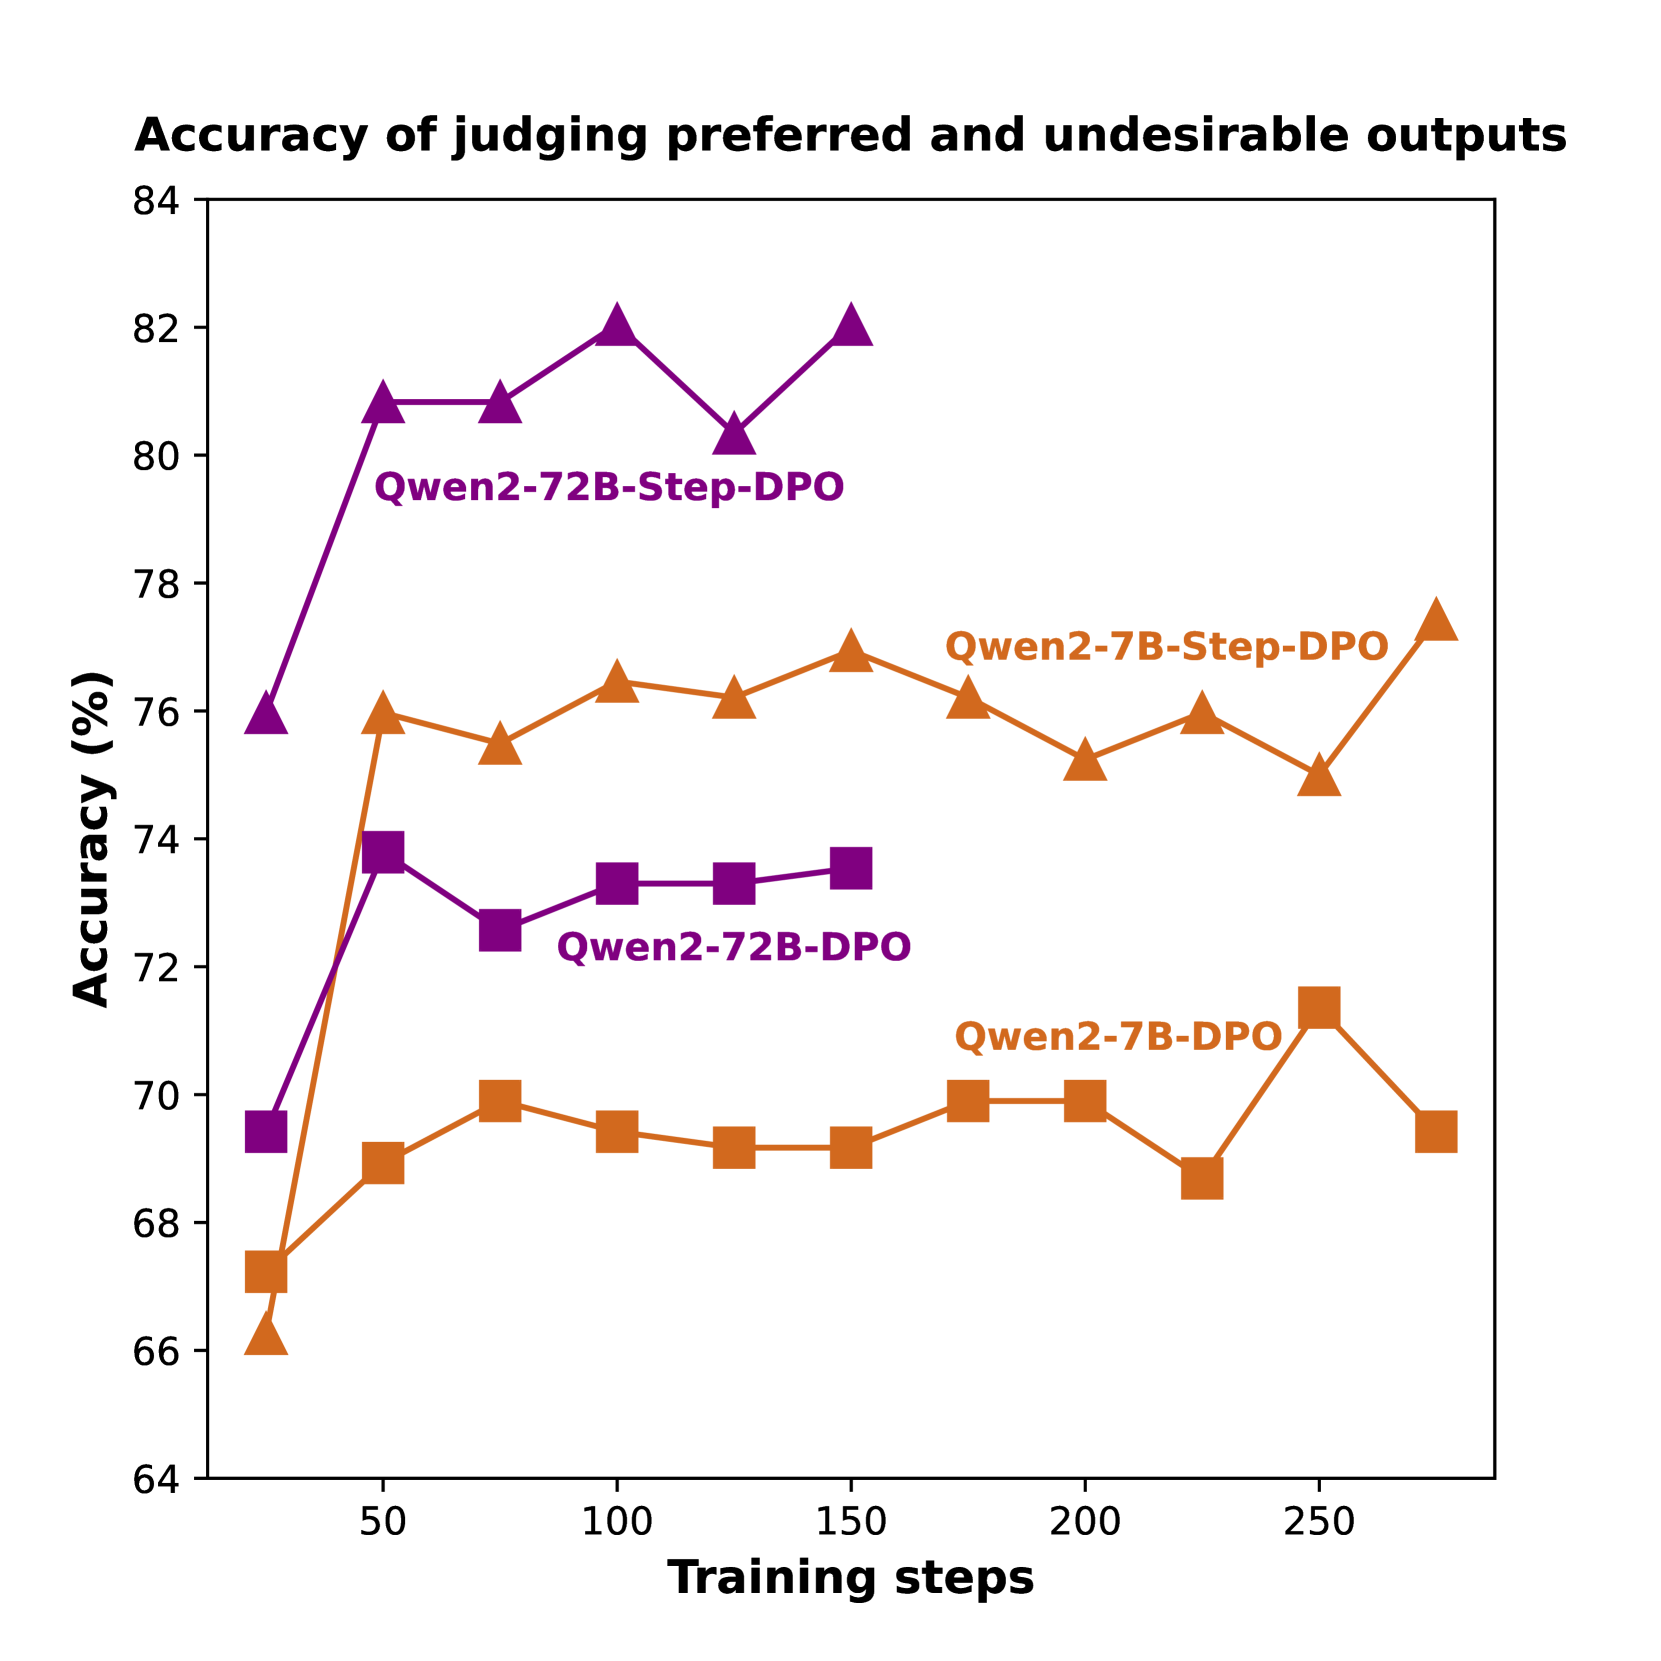
The image is a line chart comparing the accuracy of judging preferred and undesirable outputs for different models (Qwen2-72B and Qwen2-7B) using two different training methods (Step-DPO and DPO) over a range of training steps. The chart plots accuracy (in percentage) on the y-axis against training steps on the x-axis.
### Components/Axes
* **Title:** Accuracy of judging preferred and undesirable outputs
* **X-axis:** Training steps
* Scale: 50, 100, 150, 200, 250
* **Y-axis:** Accuracy (%)
* Scale: 64, 66, 68, 70, 72, 74, 76, 78, 80, 82, 84
* **Legend:**
* Purple triangles: Qwen2-72B-Step-DPO
* Purple squares: Qwen2-72B-DPO
* Orange triangles: Qwen2-7B-Step-DPO
* Orange squares: Qwen2-7B-DPO
### Detailed Analysis
* **Qwen2-72B-Step-DPO (Purple triangles):** The line starts at approximately 76% accuracy at 25 training steps, rises sharply to approximately 81% at 50 training steps, plateaus around 81% until 100 training steps, peaks at approximately 82% at 125 training steps, and then drops to approximately 82% at 150 training steps.
* **Qwen2-72B-DPO (Purple squares):** The line starts at approximately 69.5% accuracy at 25 training steps, rises to approximately 74% at 50 training steps, and then plateaus around 73% from 75 training steps onwards.
* **Qwen2-7B-Step-DPO (Orange triangles):** The line starts at approximately 66% accuracy at 25 training steps, rises to approximately 76% at 50 training steps, plateaus around 76% until 100 training steps, and then fluctuates between 75% and 77% from 100 training steps onwards.
* **Qwen2-7B-DPO (Orange squares):** The line starts at approximately 67% accuracy at 25 training steps, rises to approximately 69% at 50 training steps, plateaus around 69% until 100 training steps, and then fluctuates between 69% and 71% from 100 training steps onwards.
### Key Observations
* The Qwen2-72B-Step-DPO model (purple triangles) achieves the highest accuracy overall.
* The Qwen2-72B-Step-DPO model (purple triangles) shows a rapid increase in accuracy in the initial training steps.
* The Qwen2-72B-DPO model (purple squares) has a lower overall accuracy compared to the Qwen2-72B-Step-DPO model.
* The Qwen2-7B-Step-DPO model (orange triangles) shows a higher accuracy than the Qwen2-7B-DPO model (orange squares).
* All models show a plateauing or fluctuating accuracy after a certain number of training steps.
### Interpretation
The chart demonstrates the impact of different model sizes (72B vs. 7B) and training methods (Step-DPO vs. DPO) on the accuracy of judging preferred and undesirable outputs. The Qwen2-72B model trained with Step-DPO consistently outperforms the other models, suggesting that both larger model size and the Step-DPO training method contribute to higher accuracy in this task. The plateauing of accuracy after a certain number of training steps may indicate a point of diminishing returns or the need for further optimization strategies.