\n
## Line Chart: Kimi K2 with MuonClip - Max Logits vs. Training Steps
### Overview
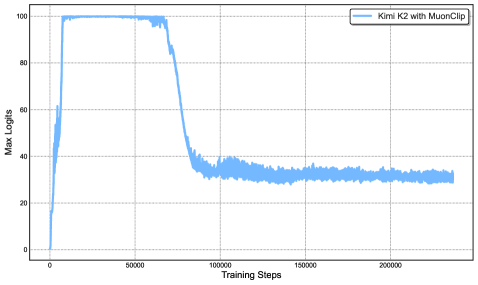
The image presents a line chart illustrating the relationship between "Training Steps" and "Max Logits" for a model named "Kimi K2 with MuonClip". The chart shows how the maximum logits value changes as the model undergoes training.
### Components/Axes
* **X-axis:** "Training Steps" - ranging from approximately 0 to 225,000. The scale is linear.
* **Y-axis:** "Max Logits" - ranging from approximately 0 to 100. The scale is linear.
* **Data Series:** A single line representing "Kimi K2 with MuonClip". The line is blue.
* **Legend:** Located in the top-right corner, labeling the line as "Kimi K2 with MuonClip" and using a blue color.
* **Grid:** A light gray grid is present, aiding in reading values from the chart.
### Detailed Analysis
The blue line representing "Kimi K2 with MuonClip" exhibits the following behavior:
1. **Initial Increase (0 - ~50,000 Training Steps):** The line rapidly increases from approximately 0 to around 95-100 Max Logits. This indicates a period of rapid learning or adjustment.
2. **Plateau (~50,000 - ~80,000 Training Steps):** The line remains relatively stable at a high value (around 95-100 Max Logits) for approximately 30,000 training steps.
3. **Rapid Decrease (~80,000 - ~120,000 Training Steps):** A steep decline occurs, dropping from approximately 95-100 Max Logits to around 30 Max Logits.
4. **Stabilization and Fluctuation (~120,000 - 225,000 Training Steps):** The line stabilizes, fluctuating between approximately 25 and 40 Max Logits. There is a slight downward trend, but it is much less pronounced than the earlier decrease.
Approximate Data Points:
* (0, 0)
* (50,000, 98)
* (80,000, 95)
* (100,000, 40)
* (120,000, 30)
* (150,000, 35)
* (200,000, 32)
* (225,000, 30)
### Key Observations
* The initial rapid increase suggests the model quickly learns initial patterns.
* The plateau indicates a period where the model's performance doesn't significantly improve with further training.
* The subsequent sharp decrease suggests a potential shift in the model's learning dynamics, possibly due to overfitting or a change in the training data distribution.
* The final stabilization with fluctuations suggests the model has converged to a relatively stable state, but with some residual variability.
### Interpretation
This chart likely represents the training process of a machine learning model. The "Max Logits" value could be interpreted as a measure of the model's confidence or the strength of its predictions. The initial rapid increase and plateau suggest the model is learning effectively. The subsequent decrease could indicate that the model is starting to overfit to the training data, or that the learning rate needs to be adjusted. The final stabilization suggests that the model has reached a point of diminishing returns, and further training may not significantly improve its performance. The fluctuations in the final stage could be due to the inherent noise in the training data or the stochastic nature of the training process. The chart suggests that the training process may have benefited from early stopping or regularization techniques to prevent overfitting.