TECHNICAL ASSET FINGERPRINT
c46ed97deabebb7f6076e184
Click to view fullscreen
Press ESC or click to close
FOUND IN PAPERS
EXPERT: gemini-2.0-flash VERSION 1
RUNTIME: nugit/gemini/gemini-2.0-flash
INTEL_VERIFIED
## Scatter Plot: Reasoning Skill and Embeddings
### Overview
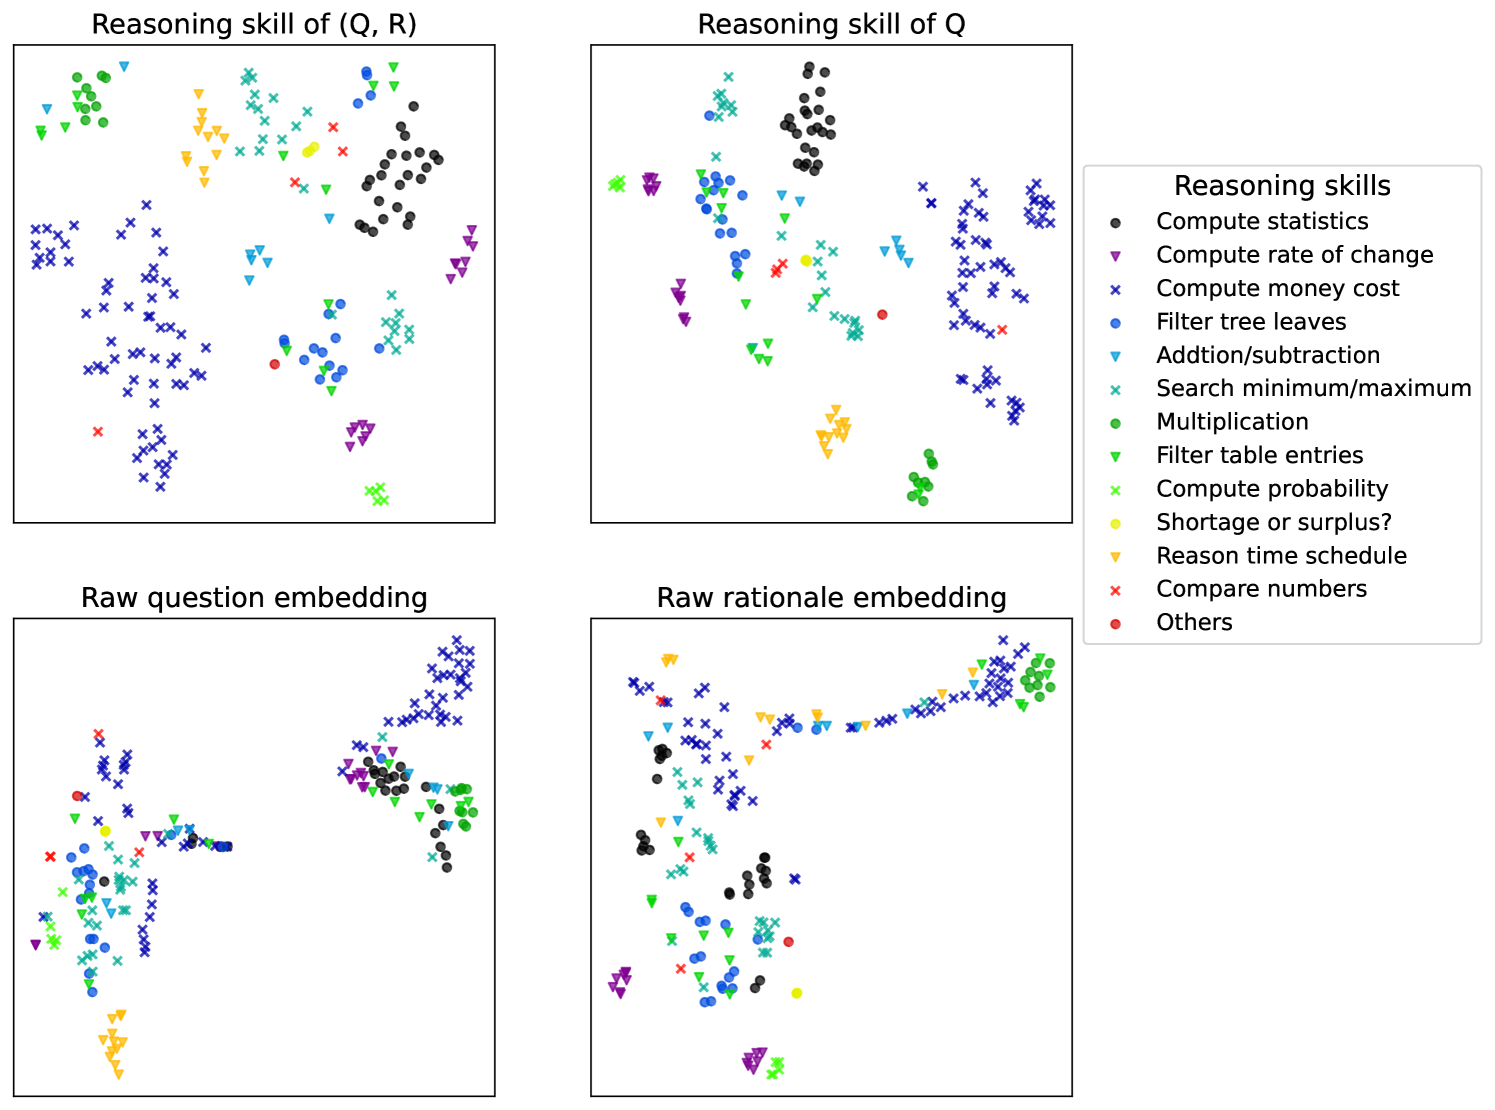
The image presents four scatter plots visualizing the distribution of different reasoning skills and embeddings. Each plot represents a different aspect: reasoning skill of (Q, R), reasoning skill of Q, raw question embedding, and raw rationale embedding. The points in each plot are color-coded and shaped according to the type of reasoning skill, as defined in the legend on the right.
### Components/Axes
* **Plots:** Four scatter plots arranged in a 2x2 grid.
* Top-left: "Reasoning skill of (Q, R)"
* Top-right: "Reasoning skill of Q"
* Bottom-left: "Raw question embedding"
* Bottom-right: "Raw rationale embedding"
* **Axes:** The axes are not explicitly labeled with scales or units. The plots appear to be projections of high-dimensional data into two dimensions, likely using a dimensionality reduction technique like t-SNE or PCA.
* **Legend (Right side of the image):**
* **Title:** "Reasoning skills"
* **Categories:**
* Black circle: Compute statistics
* Purple down-triangle: Compute rate of change
* Blue 'x': Compute money cost
* Teal 'x': Filter tree leaves
* Blue down-triangle: Addition/subtraction
* Teal 'x': Search minimum/maximum
* Green circle: Multiplication
* Green down-triangle: Filter table entries
* Light green 'x': Compute probability
* Yellow down-triangle: Shortage or surplus?
* Yellow 'x': Reason time schedule
* Red 'x': Compare numbers
* Red circle: Others
### Detailed Analysis
**1. Reasoning skill of (Q, R) [Top-Left]**
* **Compute statistics (Black circles):** Clustered in the top-right.
* **Compute rate of change (Purple down-triangles):** Scattered in the top-right and bottom-left.
* **Compute money cost (Blue 'x'):** Predominantly in the left half, forming a large cluster.
* **Filter tree leaves (Teal 'x'):** Scattered throughout the plot.
* **Addition/subtraction (Blue down-triangles):** Clustered in the center-right.
* **Search minimum/maximum (Teal 'x'):** Scattered throughout the plot.
* **Multiplication (Green circles):** Clustered in the top-left.
* **Filter table entries (Green down-triangles):** Clustered in the top-left.
* **Compute probability (Light green 'x'):** Clustered in the top-left.
* **Shortage or surplus? (Yellow down-triangles):** Clustered in the top-left.
* **Reason time schedule (Yellow 'x'):** Scattered in the top-left.
* **Compare numbers (Red 'x'):** Scattered in the left half.
* **Others (Red circle):** Located near the center.
**2. Reasoning skill of Q [Top-Right]**
* **Compute statistics (Black circles):** Clustered in the top-center.
* **Compute rate of change (Purple down-triangles):** Scattered in the top-left.
* **Compute money cost (Blue 'x'):** Predominantly in the right half, forming a large cluster.
* **Filter tree leaves (Teal 'x'):** Scattered throughout the plot.
* **Addition/subtraction (Blue down-triangles):** Clustered in the center.
* **Search minimum/maximum (Teal 'x'):** Scattered throughout the plot.
* **Multiplication (Green circles):** Clustered in the bottom-center.
* **Filter table entries (Green down-triangles):** Clustered in the top-left.
* **Compute probability (Light green 'x'):** Clustered in the top-left.
* **Shortage or surplus? (Yellow down-triangles):** Clustered in the bottom-center.
* **Reason time schedule (Yellow 'x'):** Scattered in the bottom-center.
* **Compare numbers (Red 'x'):** Scattered in the top-left.
* **Others (Red circle):** Located near the center.
**3. Raw question embedding [Bottom-Left]**
* **Compute statistics (Black circles):** Clustered in the center.
* **Compute rate of change (Purple down-triangles):** Scattered in the center-left.
* **Compute money cost (Blue 'x'):** Predominantly in the right half, forming a large cluster.
* **Filter tree leaves (Teal 'x'):** Scattered throughout the plot.
* **Addition/subtraction (Blue down-triangles):** Clustered in the center.
* **Search minimum/maximum (Teal 'x'):** Scattered throughout the plot.
* **Multiplication (Green circles):** Clustered in the center.
* **Filter table entries (Green down-triangles):** Clustered in the center.
* **Compute probability (Light green 'x'):** Clustered in the left.
* **Shortage or surplus? (Yellow down-triangles):** Clustered in the bottom-left.
* **Reason time schedule (Yellow 'x'):** Scattered in the bottom-left.
* **Compare numbers (Red 'x'):** Scattered in the left.
* **Others (Red circle):** Located near the left.
**4. Raw rationale embedding [Bottom-Right]**
* **Compute statistics (Black circles):** Clustered in the bottom-left.
* **Compute rate of change (Purple down-triangles):** Scattered in the bottom-left.
* **Compute money cost (Blue 'x'):** Predominantly in the top-right, forming a large cluster.
* **Filter tree leaves (Teal 'x'):** Scattered throughout the plot.
* **Addition/subtraction (Blue down-triangles):** Clustered in the top-center.
* **Search minimum/maximum (Teal 'x'):** Scattered throughout the plot.
* **Multiplication (Green circles):** Clustered in the top-right.
* **Filter table entries (Green down-triangles):** Clustered in the top-right.
* **Compute probability (Light green 'x'):** Clustered in the top-right.
* **Shortage or surplus? (Yellow down-triangles):** Clustered in the top-center.
* **Reason time schedule (Yellow 'x'):** Scattered in the top-center.
* **Compare numbers (Red 'x'):** Scattered in the bottom-left.
* **Others (Red circle):** Located near the bottom-left.
### Key Observations
* **Clustering:** Points representing the same reasoning skill tend to cluster together in each plot, suggesting that the embeddings capture some semantic similarity between questions requiring the same reasoning skill.
* **Distribution Differences:** The distribution of points varies across the four plots, indicating that the embeddings capture different aspects of the questions and rationales.
* **Compute Money Cost:** The "Compute money cost" skill (blue 'x') consistently forms a large, distinct cluster in the right half of the plots, suggesting it has a unique embedding signature.
* **Compute Statistics:** The "Compute statistics" skill (black circles) is clustered in all plots.
### Interpretation
The scatter plots visualize how different reasoning skills are represented in the embedding space of questions and rationales. The clustering of points with the same reasoning skill suggests that the embeddings are able to capture the semantic similarity between questions requiring the same type of reasoning. The differences in distribution across the four plots indicate that the embeddings capture different aspects of the questions and rationales, such as the reasoning skill required, the question content, and the rationale content.
The plot "Reasoning skill of (Q, R)" likely represents the combined embedding of the question (Q) and the rationale (R). Comparing this plot to "Reasoning skill of Q" shows how the inclusion of the rationale affects the representation of the reasoning skill. The "Raw question embedding" and "Raw rationale embedding" plots show the distribution of the question and rationale embeddings separately, providing insights into how each contributes to the overall representation of the reasoning skill.
The consistent clustering of "Compute money cost" suggests that this skill has a distinct embedding signature, possibly due to the presence of specific keywords or patterns in the questions and rationales related to money. The scattered distribution of other skills may indicate that they are more complex or have more diverse representations in the embedding space.
DECODING INTELLIGENCE...
EXPERT: nemotron-free VERSION 1
RUNTIME: free/nvidia/nemotron-nano-12b-v2-vl:free
INTEL_VERIFIED
## Scatter Plot Grid: Reasoning Skills and Embeddings
### Overview
The image contains a 2x2 grid of scatter plots comparing reasoning skills and embeddings. Each plot uses distinct colored markers (circles, triangles, crosses) to represent different reasoning skills, with a shared legend on the right. The plots explore relationships between reasoning skills in different contexts: (Q, R), Q alone, raw question embeddings, and raw rationale embeddings.
### Components/Axes
- **Legend**: Located on the right side, mapping 13 reasoning skills to colors and symbols:
- **Black circles**: Compute statistics
- **Purple triangles**: Compute rate of change
- **Blue crosses**: Compute money cost
- **Teal triangles**: Filter tree leaves
- **Dark blue circles**: Addition/subtraction
- **Green triangles**: Search minimum/maximum
- **Yellow circles**: Multiplication
- **Light green crosses**: Filter table entries
- **Red circles**: Compute probability
- **Orange triangles**: Shortage or surplus?
- **Pink triangles**: Reason time schedule
- **Red crosses**: Compare numbers
- **Black dots**: Others
- **Subplots**:
1. **Top-left**: "Reasoning skill of (Q, R)" – Dense clusters of multiple skills.
2. **Top-right**: "Reasoning skill of Q" – Dominated by black circles (compute statistics) and purple triangles (compute rate of change).
3. **Bottom-left**: "Raw question embedding" – Overlapping distributions with teal triangles (filter tree leaves) and blue crosses (compute money cost) forming distinct clusters.
4. **Bottom-right**: "Raw rationale embedding" – Linear trend with black circles (compute statistics) and orange triangles (shortage or surplus?) concentrated in the lower-left.
### Detailed Analysis
- **Top-left Plot**:
- **Distribution**: Scattered points across the plot, with teal triangles (filter tree leaves) and green triangles (search minimum/maximum) forming tight clusters in the upper-right quadrant.
- **Trends**: No clear linear relationship; skills are broadly dispersed.
- **Top-right Plot**:
- **Distribution**: Black circles (compute statistics) dominate the center, while purple triangles (compute rate of change) cluster in the upper-right. Blue crosses (compute money cost) are sparse.
- **Trends**: Compute statistics is the most frequent skill, followed by compute rate of change.
- **Bottom-left Plot**:
- **Distribution**: Teal triangles (filter tree leaves) and blue crosses (compute money cost) form distinct clusters in the lower-left and upper-right, respectively. Overlap occurs in the central region.
- **Trends**: Filter tree leaves and compute money cost are spatially separated, suggesting distinct embeddings.
- **Bottom-right Plot**:
- **Distribution**: Black circles (compute statistics) and orange triangles (shortage or surplus?) form a linear trend from lower-left to upper-right. Red crosses (compare numbers) cluster in the lower-right.
- **Trends**: Compute statistics and shortage/surplus? show a positive correlation.
### Key Observations
1. **Dominant Skills**: Compute statistics (black circles) appears most frequently across all plots.
2. **Clustering**: Skills like filter tree leaves (teal triangles) and compute money cost (blue crosses) show spatial separation in raw embeddings.
3. **Linear Relationship**: Compute statistics and shortage/surplus? exhibit a positive correlation in raw rationale embeddings.
4. **Symbol Consistency**: Symbols (circles, triangles, crosses) align with legend labels but lack explicit explanation for their meaning (e.g., data type or group).
### Interpretation
The plots suggest that reasoning skills are context-dependent:
- **Q vs. (Q, R)**: Skills like compute rate of change (purple triangles) are more prominent when considering only Q, while (Q, R) introduces additional skills like filter tree leaves (teal triangles).
- **Embedding Relationships**: Raw question and rationale embeddings reveal distinct clusters for certain skills (e.g., filter tree leaves vs. compute money cost), indicating separable features in the data.
- **Linear Correlation**: The positive trend between compute statistics and shortage/surplus? in raw rationale embeddings implies these skills may share underlying features or are often co-occurring in reasoning tasks.
**Uncertainties**:
- Axis labels are missing, preventing quantification of trends.
- Symbol meanings (circles vs. triangles vs. crosses) are not explained, limiting interpretation of groupings.
- Exact numerical values cannot be extracted without axis scales.
DECODING INTELLIGENCE...