TECHNICAL ASSET FINGERPRINT
c46ed97deabebb7f6076e184
Click to view fullscreen
Press ESC or click to close
FOUND IN PAPERS
EXPERT: gemini-2.0-flash VERSION 1
RUNTIME: nugit/gemini/gemini-2.0-flash
INTEL_VERIFIED
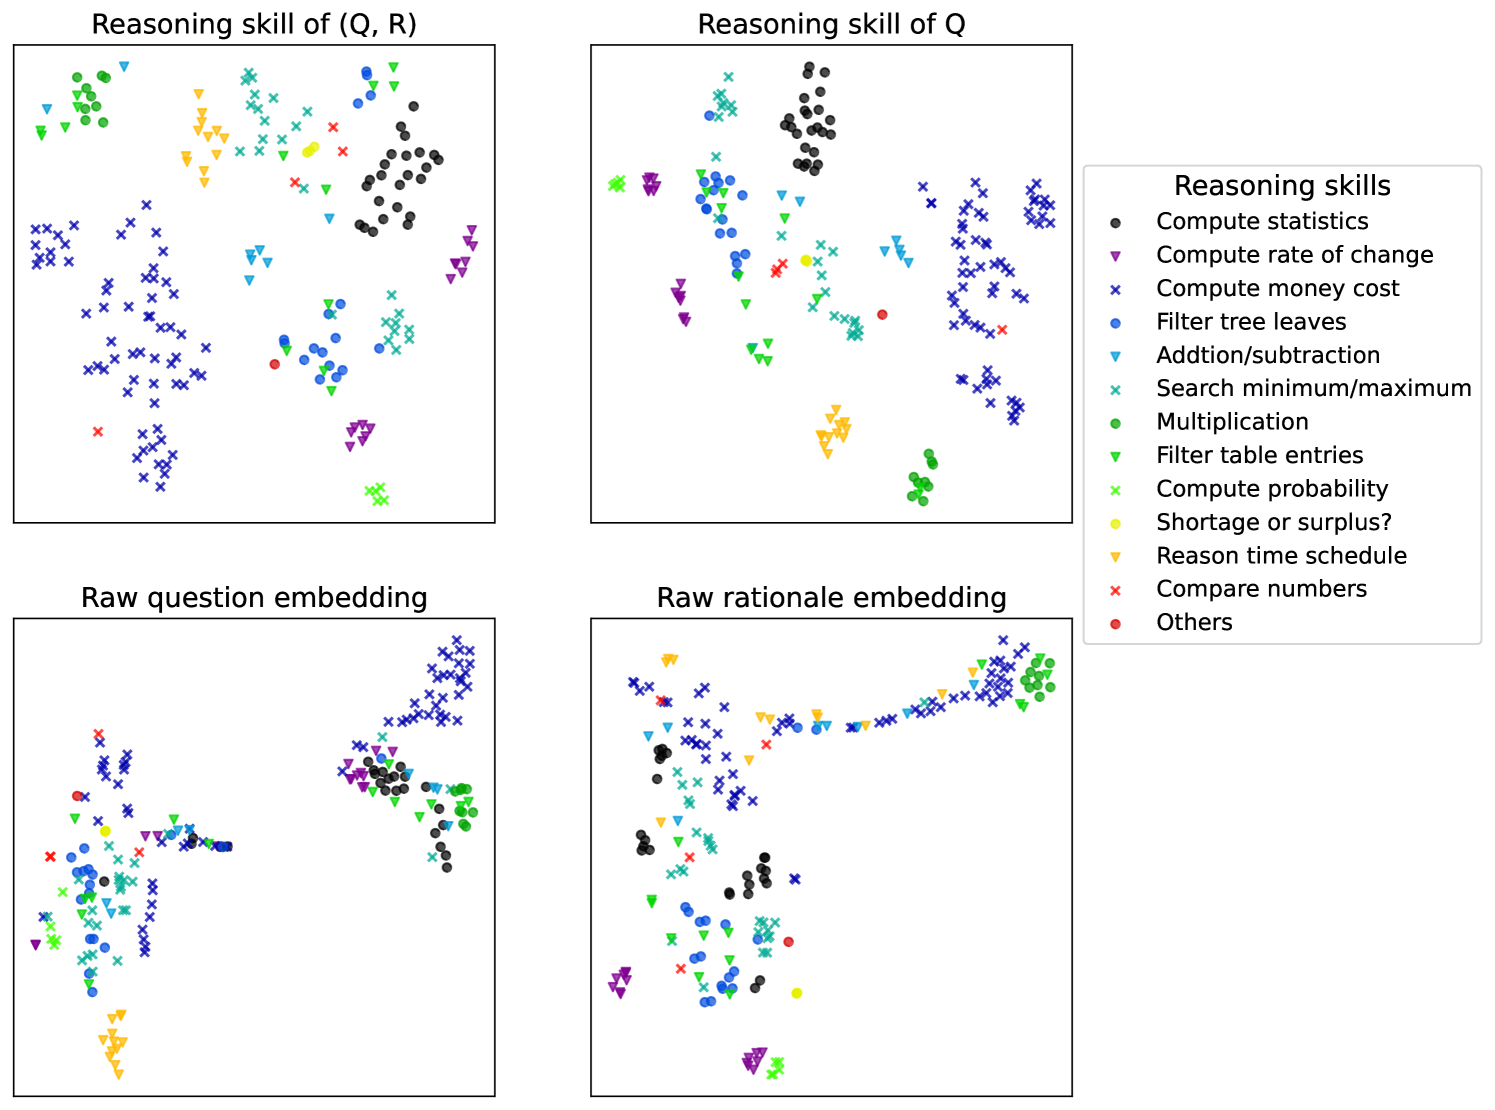
## Scatter Plot: Reasoning Skill and Embeddings
### Overview
The image presents four scatter plots visualizing the distribution of different reasoning skills and embeddings. Each plot represents a different aspect: reasoning skill of (Q, R), reasoning skill of Q, raw question embedding, and raw rationale embedding. The points in each plot are color-coded and shaped according to the type of reasoning skill, as defined in the legend on the right.
### Components/Axes
* **Plots:** Four scatter plots arranged in a 2x2 grid.
* Top-left: "Reasoning skill of (Q, R)"
* Top-right: "Reasoning skill of Q"
* Bottom-left: "Raw question embedding"
* Bottom-right: "Raw rationale embedding"
* **Axes:** The axes are not explicitly labeled with scales or units. The plots appear to be projections of high-dimensional data into two dimensions, likely using a dimensionality reduction technique like t-SNE or PCA.
* **Legend (Right side of the image):**
* **Title:** "Reasoning skills"
* **Categories:**
* Black circle: Compute statistics
* Purple down-triangle: Compute rate of change
* Blue 'x': Compute money cost
* Teal 'x': Filter tree leaves
* Blue down-triangle: Addition/subtraction
* Teal 'x': Search minimum/maximum
* Green circle: Multiplication
* Green down-triangle: Filter table entries
* Light green 'x': Compute probability
* Yellow down-triangle: Shortage or surplus?
* Yellow 'x': Reason time schedule
* Red 'x': Compare numbers
* Red circle: Others
### Detailed Analysis
**1. Reasoning skill of (Q, R) [Top-Left]**
* **Compute statistics (Black circles):** Clustered in the top-right.
* **Compute rate of change (Purple down-triangles):** Scattered in the top-right and bottom-left.
* **Compute money cost (Blue 'x'):** Predominantly in the left half, forming a large cluster.
* **Filter tree leaves (Teal 'x'):** Scattered throughout the plot.
* **Addition/subtraction (Blue down-triangles):** Clustered in the center-right.
* **Search minimum/maximum (Teal 'x'):** Scattered throughout the plot.
* **Multiplication (Green circles):** Clustered in the top-left.
* **Filter table entries (Green down-triangles):** Clustered in the top-left.
* **Compute probability (Light green 'x'):** Clustered in the top-left.
* **Shortage or surplus? (Yellow down-triangles):** Clustered in the top-left.
* **Reason time schedule (Yellow 'x'):** Scattered in the top-left.
* **Compare numbers (Red 'x'):** Scattered in the left half.
* **Others (Red circle):** Located near the center.
**2. Reasoning skill of Q [Top-Right]**
* **Compute statistics (Black circles):** Clustered in the top-center.
* **Compute rate of change (Purple down-triangles):** Scattered in the top-left.
* **Compute money cost (Blue 'x'):** Predominantly in the right half, forming a large cluster.
* **Filter tree leaves (Teal 'x'):** Scattered throughout the plot.
* **Addition/subtraction (Blue down-triangles):** Clustered in the center.
* **Search minimum/maximum (Teal 'x'):** Scattered throughout the plot.
* **Multiplication (Green circles):** Clustered in the bottom-center.
* **Filter table entries (Green down-triangles):** Clustered in the top-left.
* **Compute probability (Light green 'x'):** Clustered in the top-left.
* **Shortage or surplus? (Yellow down-triangles):** Clustered in the bottom-center.
* **Reason time schedule (Yellow 'x'):** Scattered in the bottom-center.
* **Compare numbers (Red 'x'):** Scattered in the top-left.
* **Others (Red circle):** Located near the center.
**3. Raw question embedding [Bottom-Left]**
* **Compute statistics (Black circles):** Clustered in the center.
* **Compute rate of change (Purple down-triangles):** Scattered in the center-left.
* **Compute money cost (Blue 'x'):** Predominantly in the right half, forming a large cluster.
* **Filter tree leaves (Teal 'x'):** Scattered throughout the plot.
* **Addition/subtraction (Blue down-triangles):** Clustered in the center.
* **Search minimum/maximum (Teal 'x'):** Scattered throughout the plot.
* **Multiplication (Green circles):** Clustered in the center.
* **Filter table entries (Green down-triangles):** Clustered in the center.
* **Compute probability (Light green 'x'):** Clustered in the left.
* **Shortage or surplus? (Yellow down-triangles):** Clustered in the bottom-left.
* **Reason time schedule (Yellow 'x'):** Scattered in the bottom-left.
* **Compare numbers (Red 'x'):** Scattered in the left.
* **Others (Red circle):** Located near the left.
**4. Raw rationale embedding [Bottom-Right]**
* **Compute statistics (Black circles):** Clustered in the bottom-left.
* **Compute rate of change (Purple down-triangles):** Scattered in the bottom-left.
* **Compute money cost (Blue 'x'):** Predominantly in the top-right, forming a large cluster.
* **Filter tree leaves (Teal 'x'):** Scattered throughout the plot.
* **Addition/subtraction (Blue down-triangles):** Clustered in the top-center.
* **Search minimum/maximum (Teal 'x'):** Scattered throughout the plot.
* **Multiplication (Green circles):** Clustered in the top-right.
* **Filter table entries (Green down-triangles):** Clustered in the top-right.
* **Compute probability (Light green 'x'):** Clustered in the top-right.
* **Shortage or surplus? (Yellow down-triangles):** Clustered in the top-center.
* **Reason time schedule (Yellow 'x'):** Scattered in the top-center.
* **Compare numbers (Red 'x'):** Scattered in the bottom-left.
* **Others (Red circle):** Located near the bottom-left.
### Key Observations
* **Clustering:** Points representing the same reasoning skill tend to cluster together in each plot, suggesting that the embeddings capture some semantic similarity between questions requiring the same reasoning skill.
* **Distribution Differences:** The distribution of points varies across the four plots, indicating that the embeddings capture different aspects of the questions and rationales.
* **Compute Money Cost:** The "Compute money cost" skill (blue 'x') consistently forms a large, distinct cluster in the right half of the plots, suggesting it has a unique embedding signature.
* **Compute Statistics:** The "Compute statistics" skill (black circles) is clustered in all plots.
### Interpretation
The scatter plots visualize how different reasoning skills are represented in the embedding space of questions and rationales. The clustering of points with the same reasoning skill suggests that the embeddings are able to capture the semantic similarity between questions requiring the same type of reasoning. The differences in distribution across the four plots indicate that the embeddings capture different aspects of the questions and rationales, such as the reasoning skill required, the question content, and the rationale content.
The plot "Reasoning skill of (Q, R)" likely represents the combined embedding of the question (Q) and the rationale (R). Comparing this plot to "Reasoning skill of Q" shows how the inclusion of the rationale affects the representation of the reasoning skill. The "Raw question embedding" and "Raw rationale embedding" plots show the distribution of the question and rationale embeddings separately, providing insights into how each contributes to the overall representation of the reasoning skill.
The consistent clustering of "Compute money cost" suggests that this skill has a distinct embedding signature, possibly due to the presence of specific keywords or patterns in the questions and rationales related to money. The scattered distribution of other skills may indicate that they are more complex or have more diverse representations in the embedding space.
DECODING INTELLIGENCE...