TECHNICAL ASSET FINGERPRINT
c48ea801a84caafe39515ebe
Click to view fullscreen
Press ESC or click to close
FOUND IN PAPERS
EXPERT: gemini-2.0-flash VERSION 1
RUNTIME: nugit/gemini/gemini-2.0-flash
INTEL_VERIFIED
## RAG System Comparison Diagram
### Overview
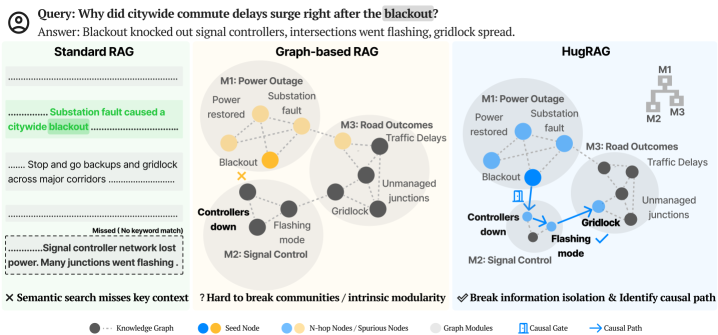
The image presents a comparison of three different Retrieval-Augmented Generation (RAG) systems: Standard RAG, Graph-based RAG, and HugRAG. It illustrates how each system handles the query "Why did citywide commute delays surge right after the blackout?" by showing the flow of information and the connections between different concepts. The diagram highlights the strengths and weaknesses of each approach in terms of context retrieval and causal reasoning.
### Components/Axes
* **Title:** Query: Why did citywide commute delays surge right after the blackout?
Answer: Blackout knocked out signal controllers, intersections went flashing, gridlock spread.
* **RAG Systems:**
* Standard RAG
* Graph-based RAG
* HugRAG
* **Nodes:** Represent concepts or entities.
* **Edges:** Represent relationships between concepts.
* **Modules:** M1: Power Outage, M2: Signal Control, M3: Road Outcomes
* **Legend:** Located at the bottom of the image.
* Knowledge Graph (gray dotted line)
* Seed Node (blue circle)
* N-hop Nodes / Spurious Nodes (yellow circle)
* Graph Modules (light gray shaded area)
* Causal Gate (blue icon of a gate)
* Causal Path (blue arrow)
### Detailed Analysis
**1. Standard RAG (Left)**
* **Description:** This system retrieves text snippets based on keyword matching.
* **Text Snippets:**
* "Substation fault caused a citywide blackout" (highlighted in green)
* "Stop and go backups and gridlock across major corridors"
* "Signal controller network lost power. Many junctions went flashing." (marked as "Missed (No keyword match)")
* **Analysis:** The system successfully retrieves information about the blackout but misses the connection between signal controller failure and traffic delays.
* **Semantic Search:** "X Semantic search misses key context"
**2. Graph-based RAG (Center)**
* **Description:** This system uses a knowledge graph to represent relationships between concepts.
* **Modules:**
* M1: Power Outage (Power restored, Substation fault, Blackout)
* M2: Signal Control (Controllers down, Flashing mode)
* M3: Road Outcomes (Traffic Delays, Unmanaged junctions, Gridlock)
* **Nodes:**
* Blackout (marked with an "X")
* Controllers down
* Flashing mode
* Gridlock
* Unmanaged junctions
* Traffic Delays
* Power restored
* Substation fault
* **Analysis:** The system represents the relationships between power outage, signal control, and road outcomes. However, it struggles to identify the causal path.
* **Community Breaking:** "? Hard to break communities / intrinsic modularity"
**3. HugRAG (Right)**
* **Description:** This system combines knowledge graph representation with causal reasoning.
* **Modules:**
* M1: Power Outage (Power restored, Substation fault, Blackout)
* M2: Signal Control (Controllers down, Flashing mode)
* M3: Road Outcomes (Traffic Delays, Unmanaged junctions, Gridlock)
* **Nodes:**
* Blackout
* Controllers down
* Flashing mode
* Gridlock
* Unmanaged junctions
* Traffic Delays
* Power restored
* Substation fault
* **Causal Path:** A blue arrow indicates the causal path from "Blackout" to "Controllers down" to "Flashing mode" to "Gridlock" to "Traffic Delays".
* **Causal Gate:** A blue gate icon is present between "Blackout" and "Controllers down".
* **Analysis:** The system successfully identifies the causal path from the blackout to traffic delays through signal controller failure.
* **Information Isolation:** "✓ Break information isolation & Identify causal path"
### Key Observations
* Standard RAG relies on keyword matching and misses contextual information.
* Graph-based RAG represents relationships but struggles with causal reasoning.
* HugRAG combines graph representation with causal reasoning to identify the causal path.
### Interpretation
The diagram demonstrates the evolution of RAG systems from simple keyword-based retrieval to more sophisticated approaches that incorporate knowledge graphs and causal reasoning. HugRAG appears to be the most effective system, as it successfully identifies the causal path between the blackout and traffic delays. This suggests that incorporating causal reasoning into RAG systems can improve their ability to answer complex questions and provide more informative responses. The "Causal Gate" likely represents a point where causal inference is applied to determine the most likely cause-and-effect relationship. The diagram highlights the importance of context and causal reasoning in information retrieval and generation.
DECODING INTELLIGENCE...
EXPERT: nemotron-free VERSION 1
RUNTIME: free/nvidia/nemotron-nano-12b-v2-vl:free
INTEL_VERIFIED
## Diagram: Comparison of RAG Methods for Blackout Analysis
### Overview
The image compares three Retrieval-Augmented Generation (RAG) methods—Standard RAG, Graph-based RAG, and HugRAG—using diagrams and text to explain how each handles a query about citywide commute delays caused by a blackout. The diagrams use color-coded nodes and connections to represent knowledge graphs, causal relationships, and modularity.
---
### Components/Axes
1. **Query & Answer Section**
- **Text**:
- Query: *"Why did citywide commute delays surge right after the blackout?"*
- Answer: *"Blackout knocked out signal controllers, intersections went flashing, gridlock spread."*
- **Highlighted Text**:
- *"Substation fault caused a citywide blackout"* (Standard RAG)
- *"Signal controller network lost power. Many junctions went flashing"* (Standard RAG)
2. **Standard RAG Diagram**
- **Text**:
- *"Substation fault caused a citywide blackout"*
- *"Stop and go backups and gridlock across major corridors"*
- *"Signal controller network lost power. Many junctions went flashing"*
- **Color Legend**:
- Black dots: Knowledge Graph
- Blue: Seed Node
- Yellow: N-hop Nodes (Spurious Nodes)
- Gray: Graph Modules
- Blue arrows: Causal Gate
- Blue arrows with checkmark: Causal Path
3. **Graph-based RAG Diagram**
- **Nodes**:
- **M1**: Power Outage (yellow), Substation restored (yellow), Blackout (yellow)
- **M2**: Signal Control (black), Controllers down (black), Flashing mode (black)
- **M3**: Road Outcomes (black), Traffic Delays (black), Unmanaged junctions (black)
- **Connections**:
- M1 → M2 (Power Outage → Signal Control)
- M2 → M3 (Gridlock → Traffic Delays)
- **Text**:
- *"Hard to break communities / intrinsic modularity"*
4. **HugRAG Diagram**
- **Nodes**:
- **M1**: Power Outage (blue), Substation restored (blue), Blackout (blue)
- **M2**: Signal Control (black), Controllers down (black), Flashing mode (black)
- **M3**: Road Outcomes (black), Traffic Delays (black), Unmanaged junctions (black)
- **Connections**:
- M1 → M2 → M3 (Causal Path: Power Outage → Signal Control → Traffic Delays)
- **Text**:
- *"Break information isolation & Identify causal path"*
---
### Detailed Analysis
1. **Standard RAG**
- **Text Content**:
- Highlights "Substation fault caused a citywide blackout" and "Signal controller network lost power."
- Misses key context: *"Semantic search misses key context"* (marked with an X).
- **Diagram**:
- No explicit nodes or connections. Relies on textual summaries.
2. **Graph-based RAG**
- **Nodes**:
- **M1 (Power Outage)**: Yellow (Seed Node)
- **M2 (Signal Control)**: Black (Knowledge Graph)
- **M3 (Road Outcomes)**: Black (Knowledge Graph)
- **Connections**:
- M1 → M2 (Power Outage → Signal Control)
- M2 → M3 (Gridlock → Traffic Delays)
- **Text**:
- *"Hard to break communities / intrinsic modularity"* (indicates limitations in modularity).
3. **HugRAG**
- **Nodes**:
- **M1 (Power Outage)**: Blue (N-hop Node)
- **M2 (Signal Control)**: Black (Knowledge Graph)
- **M3 (Road Outcomes)**: Black (Knowledge Graph)
- **Connections**:
- M1 → M2 → M3 (Causal Path: Power Outage → Signal Control → Traffic Delays)
- **Text**:
- *"Break information isolation & Identify causal path"* (emphasizes causal reasoning).
---
### Key Observations
1. **Standard RAG**
- Relies on text summaries but fails to capture causal relationships (e.g., "Semantic search misses key context").
- Highlights critical events (substation fault, signal controller failure) but lacks structural analysis.
2. **Graph-based RAG**
- Uses nodes to represent events (e.g., Power Outage, Signal Control) and connections to show relationships.
- Struggles with modularity ("Hard to break communities"), suggesting difficulty in isolating specific causal chains.
3. **HugRAG**
- Explicitly identifies a **causal path** (M1 → M2 → M3) using blue arrows with checkmarks.
- Combines modularity (graph modules) with causal reasoning (causal gates).
---
### Interpretation
1. **Standard RAG**
- Provides a basic summary but lacks depth in explaining causality. Its failure to capture key context (e.g., "signal controller network lost power") suggests limitations in retrieval precision.
2. **Graph-based RAG**
- Represents events as nodes and relationships as edges but cannot fully disentangle modular components (e.g., "intrinsic modularity" issue). This may lead to incomplete or fragmented explanations.
3. **HugRAG**
- Outperforms others by explicitly tracing the causal chain (Power Outage → Signal Control → Traffic Delays). The use of **causal gates** and **causal paths** indicates a structured approach to linking events, making it more effective for complex queries.
4. **Color Coding Significance**
- **Yellow (Seed Nodes)**: Highlight critical events (e.g., Power Outage) in Graph-based RAG.
- **Blue (N-hop Nodes)**: Represent intermediate steps in HugRAG’s causal path.
- **Black (Knowledge Graph)**: Core events (e.g., Signal Control) are consistently marked across methods.
---
### Conclusion
The diagram illustrates how HugRAG’s integration of causal reasoning and modularity surpasses Standard RAG and Graph-based RAG in explaining complex, interconnected events like blackouts. By breaking information isolation and identifying causal paths, HugRAG provides a more accurate and structured analysis of the root causes and consequences of citywide commute delays.
DECODING INTELLIGENCE...