## Diagram: Set Relationships
### Overview
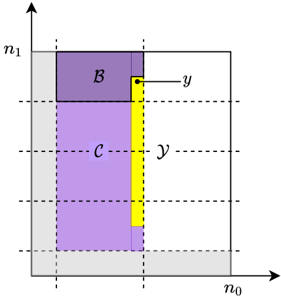
The image is a diagram illustrating the relationships between sets B and C within a larger space. The diagram uses a coordinate system with axes labeled n0 and n1. The sets B and C are represented by shaded regions, and a vertical yellow bar intersects both sets. A point 'y' is marked at the intersection of the yellow bar and set B.
### Components/Axes
* **Axes:**
* Horizontal axis: n0
* Vertical axis: n1
* **Sets:**
* Set B: Represented by a purple shaded rectangle in the top-left region.
* Set C: Represented by a light purple shaded rectangle below set B.
* **Yellow Bar:** A vertical yellow bar intersecting both sets B and C.
* **Point y:** A black dot labeled 'y' at the intersection of the yellow bar and the top edge of set B.
* **Background:** A grid of dashed lines over a light gray background.
### Detailed Analysis or ### Content Details
* **Set B:** Located in the top-left corner, extending approximately from n0 = 0 to n0 = 0.5 and from n1 = 0.5 to n1 = 1.
* **Set C:** Located below set B, extending approximately from n0 = 0 to n0 = 0.5 and from n1 = 0 to n1 = 0.5.
* **Yellow Bar:** Positioned around n0 = 0.5, extending vertically from approximately n1 = 0 to n1 = 0.75.
* **Point y:** Located at the top of the yellow bar, at approximately n0 = 0.5 and n1 = 0.75.
### Key Observations
* Sets B and C are adjacent, with B above C.
* The yellow bar intersects both sets, indicating a relationship or connection between them.
* Point 'y' marks a specific location within set B, potentially highlighting a key element or boundary.
### Interpretation
The diagram visually represents the spatial relationships between sets B and C. The yellow bar suggests a shared attribute or connection between elements within these sets. Point 'y' could represent a specific element or condition related to both the yellow bar and set B. The diagram likely serves to illustrate a concept or relationship within a mathematical or logical context.