\n
## Diagram: Clinical Reasoning for GERD Diagnosis
### Overview
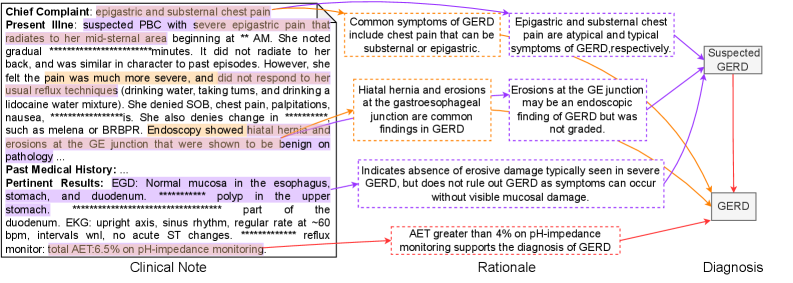
This diagram illustrates the clinical reasoning process for diagnosing Gastroesophageal Reflux Disease (GERD). It connects clinical notes (patient symptoms and test results) to rationales (medical explanations) and ultimately to a diagnosis (Suspected GERD or GERD). The diagram uses a network of lines to show the relationships between these elements. The clinical note is presented as a block of text on the left, while the rationale and diagnosis are presented in boxes on the right.
### Components/Axes
The diagram consists of three main sections:
1. **Clinical Note:** A text block containing patient information.
2. **Rationale:** Boxes containing medical explanations and supporting evidence.
3. **Diagnosis:** Boxes indicating potential diagnoses.
The diagram uses colored lines to connect the clinical note to the rationale and diagnosis. The colors are:
* **Blue:** Connecting symptoms to suspected GERD.
* **Orange:** Connecting findings to GERD.
* **Red:** Connecting test results to GERD.
* **Gray:** Connecting findings to suspected GERD.
### Detailed Analysis or Content Details
**Clinical Note (Left Side):**
The clinical note contains the following information (with approximate values where indicated):
* **Chief Complaint:** Epigastric and substernal chest pain.
* **Present Illness:** Suspected PBC (Primary Biliary Cholangitis) with severe epigastric pain radiating to mid-sternal area beginning at approximately “**AM**. Pain is gradual, lasting approximately “**minutes**”. No radiation to the back. Pain is more severe and unresponsive to usual techniques. Denies SOB, chest pain, palpitations, nausea, and changes in stool. Endoscopy showed hiatal hernia and erosions at the GE junction, benign on pathology.
* **Past Medical History:** Not fully transcribed.
* **Pertinent Results:**
* EGD: Normal mucosa in the esophagus, stomach, and duodenum. Polyp in the upper stomach. Part of the duodenum.
* EKG: upright axis, sinus rhythm, regular rate at ~**60 bpm**, intervals normal, no acute ST changes.
* Reflux monitor: total AET 6.5% on pH-impedance monitoring.
**Rationale (Center):**
* **Box 1 (Top):** "Common symptoms of GERD include chest pain that can be substernal or epigastric."
* **Box 2 (Middle):** "Hiatal hernia and erosions at the gastroesophageal junction are common findings in GERD."
* **Box 3 (Bottom):** "AET greater than 4% on pH-impedance monitoring supports the diagnosis of GERD."
* **Box 4 (Middle):** "Erosions at the GE junction may be an endoscopic finding of GERD but was not graded."
* **Box 5 (Bottom):** "Indicates absence of erosive damage typically seen in severe GERD, but does not rule out GERD as symptoms can occur without visible mucosal damage."
**Diagnosis (Right Side):**
* **Box 1 (Top):** "Suspected GERD"
* **Box 2 (Bottom):** "GERD"
**Connections (Lines):**
* **Blue Lines:** Connect "epigastric and substernal chest pain" and "atypical and typical symptoms of GERD respectively" to "Suspected GERD".
* **Orange Lines:** Connect "Hiatal hernia and erosions at the gastroesophageal junction" and "Erosions at the GE junction" to "GERD".
* **Red Line:** Connects "AET greater than 4%" to "GERD".
* **Gray Line:** Connects "Hiatal hernia and erosions at the gastroesophageal junction" to "Suspected GERD".
### Key Observations
* The diagram highlights that GERD diagnosis is based on a combination of symptoms, endoscopic findings, and pH-impedance monitoring results.
* The presence of a hiatal hernia and erosions can support both "Suspected GERD" and "GERD" diagnoses.
* AET > 4% is a strong indicator of GERD.
* The diagram acknowledges that GERD can be present even without visible erosive damage.
### Interpretation
This diagram represents a simplified clinical decision-making process for GERD. It demonstrates how clinicians integrate subjective patient reports (symptoms) with objective findings (endoscopy, pH monitoring) to arrive at a diagnosis. The use of colored lines visually emphasizes the strength of the association between different pieces of evidence and potential diagnoses. The diagram suggests that a diagnosis of "GERD" requires more definitive evidence (e.g., AET > 4%) than a diagnosis of "Suspected GERD," which can be based on symptoms alone. The inclusion of the "Suspected GERD" diagnosis acknowledges the possibility of a provisional diagnosis when further investigation is needed. The diagram is a visual aid for understanding the complex interplay of factors involved in GERD diagnosis.