## Bar Chart: CoC (Interweave)
### Overview
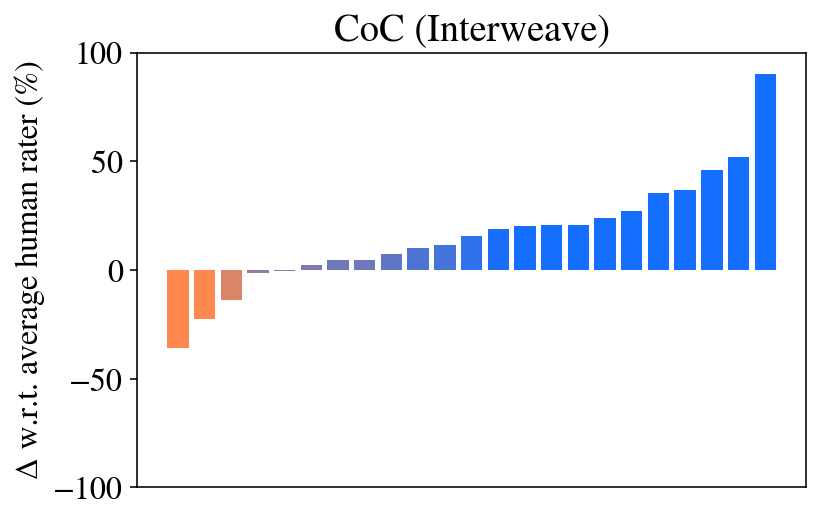
The image is a bar chart titled "CoC (Interweave)". The chart displays the difference in performance relative to the average human rater, expressed as a percentage. The x-axis represents different categories (unspecified), and the y-axis represents the percentage difference. The bars are colored in a gradient from orange to blue, indicating a transition from negative to positive differences.
### Components/Axes
* **Title:** CoC (Interweave)
* **Y-axis Label:** Δ w.r.t. average human rater (%)
* **Y-axis Scale:** -100, -50, 0, 50, 100
* **X-axis:** No explicit label, but represents different categories or data points.
### Detailed Analysis
The bar chart shows a progression of values from negative to positive.
* **Initial Bars (Orange):** The first few bars are orange and represent negative values.
* The first bar is approximately -35%.
* The second bar is approximately -25%.
* The third bar is approximately -10%.
* **Transition Bars (Gradient):** The bars gradually transition from orange to blue, crossing the 0% line.
* The bar that crosses 0% is approximately at 1%.
* **Final Bars (Blue):** The remaining bars are blue and represent positive values.
* The values increase gradually, with the last few bars showing a more significant increase.
* The last bar is approximately 90%.
### Key Observations
* There is a clear trend of increasing performance relative to the average human rater.
* The chart shows a range of performance differences, from significantly below average to significantly above average.
* The color gradient visually represents the transition from negative to positive differences.
### Interpretation
The bar chart illustrates the performance of different categories or data points compared to the average human rater. The negative values (orange bars) indicate categories where performance is worse than the average human rater, while the positive values (blue bars) indicate categories where performance is better. The increasing trend suggests that, overall, the performance tends to be better than the average human rater for most of the categories represented in the chart. The "CoC (Interweave)" title might refer to a specific method or system being evaluated. Without further context, it's difficult to determine the exact nature of the categories represented on the x-axis.