\n
## Grouped Bar Chart with Overlaid Line Plots: Model Performance vs. Training Sample Size
### Overview
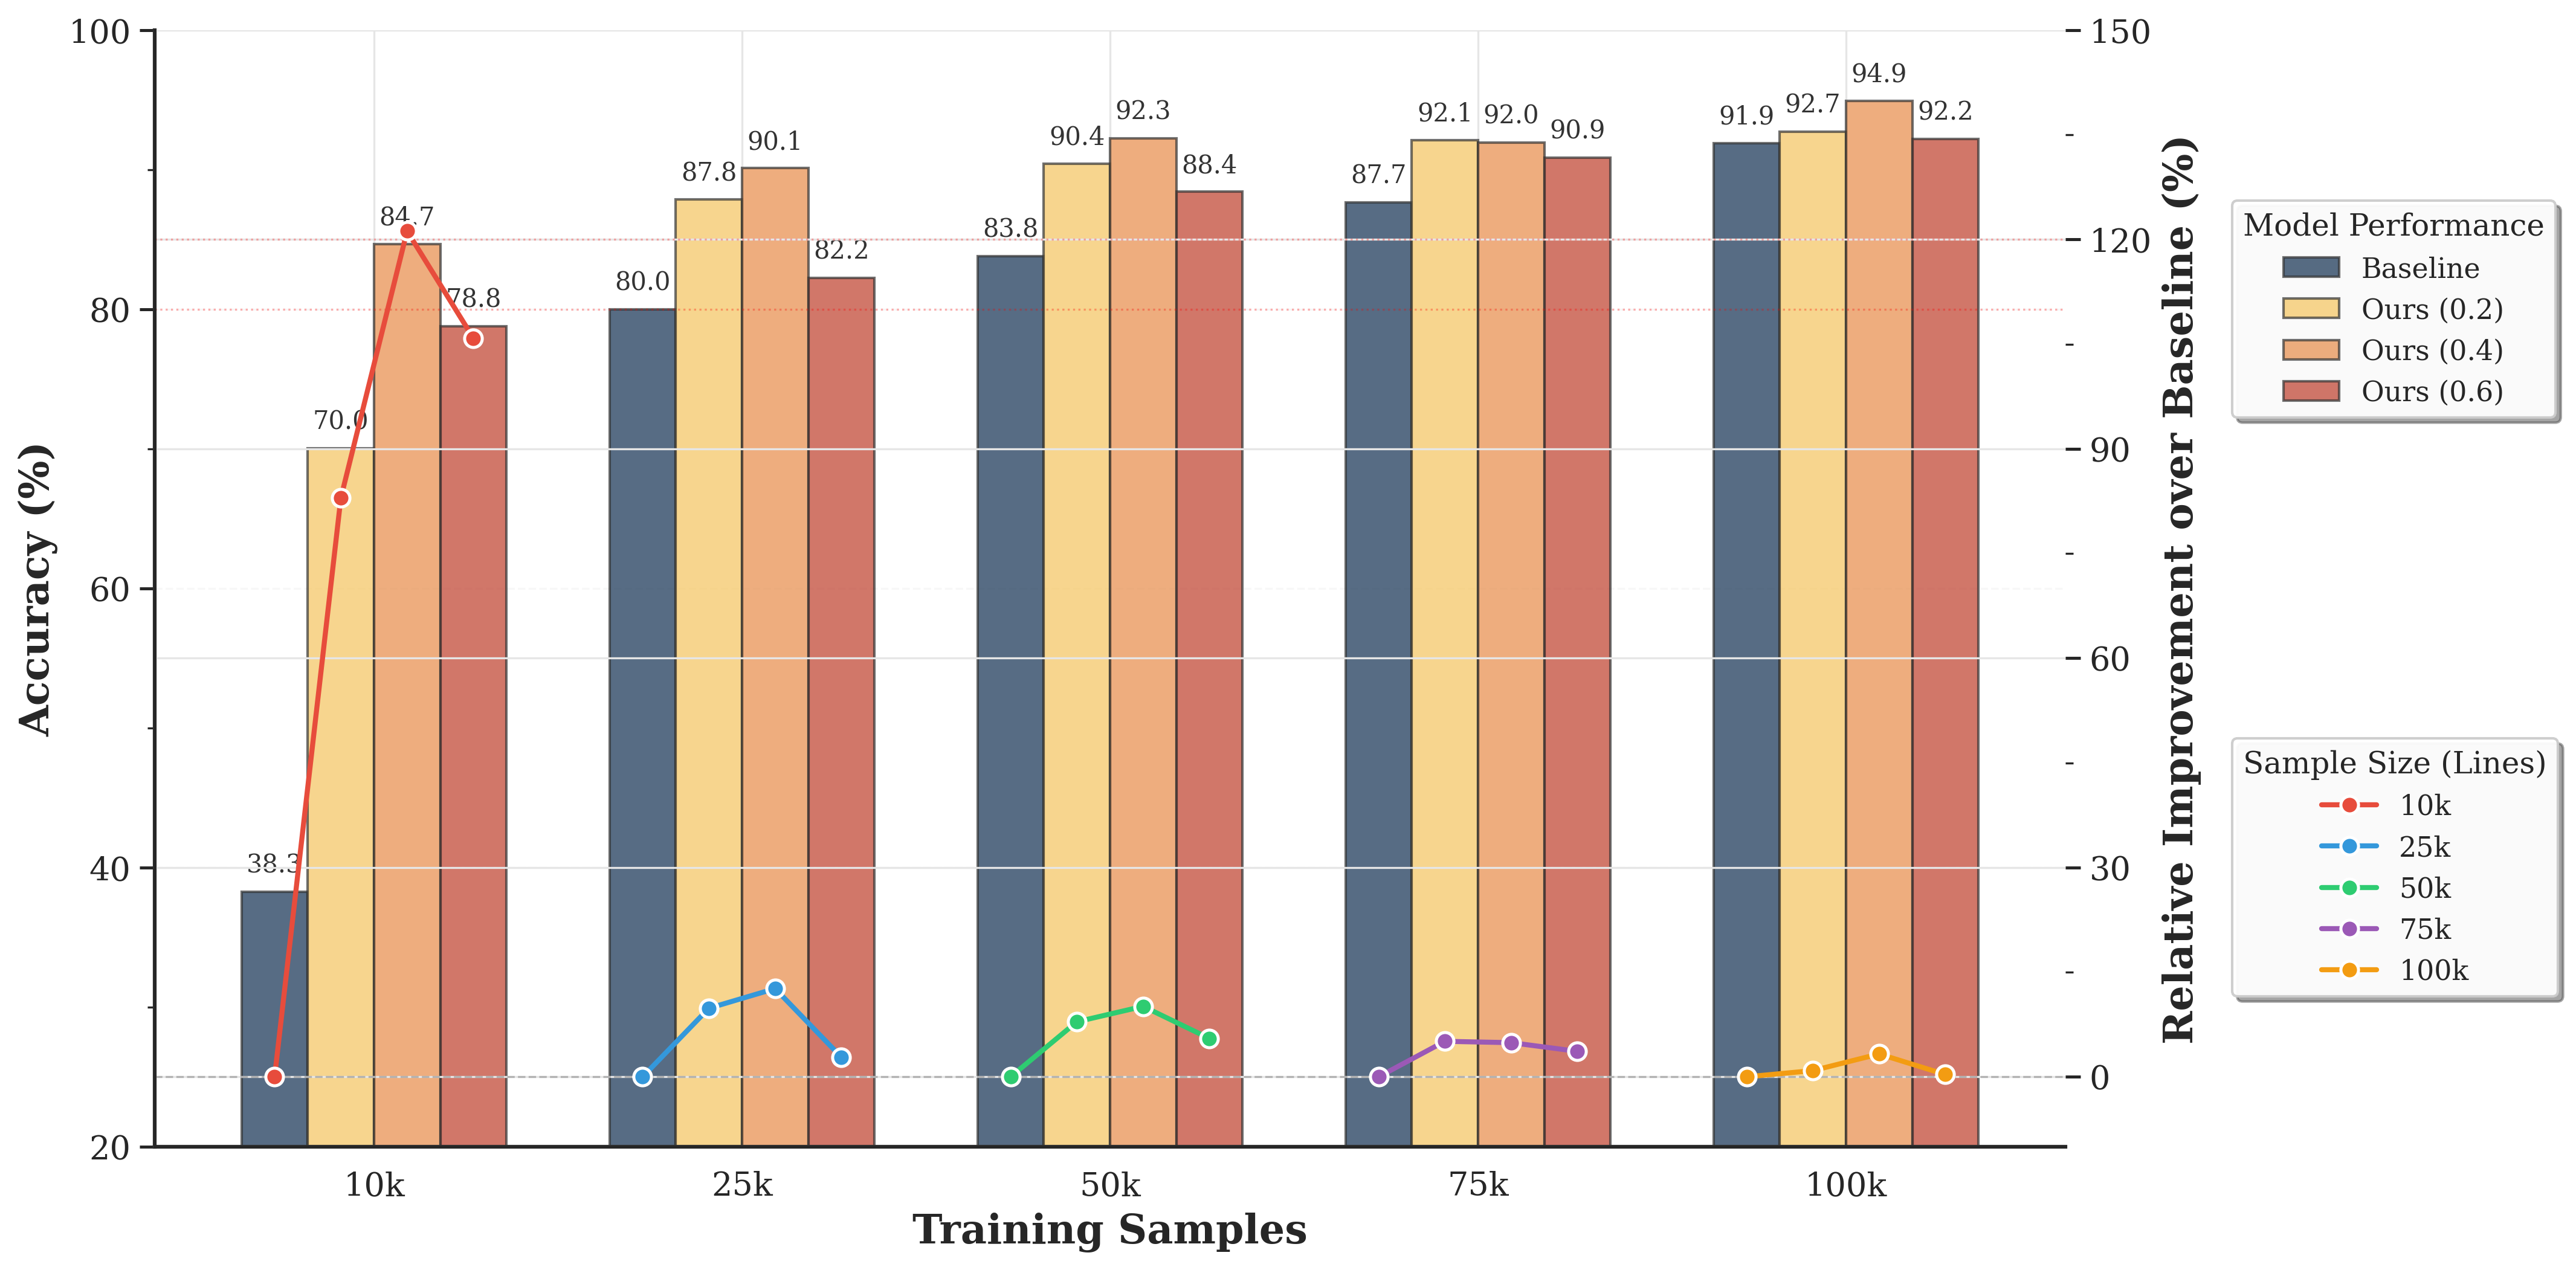
This image is a technical chart comparing the performance of different machine learning models across varying training dataset sizes. It uses a dual-axis design: grouped bars represent absolute accuracy percentages, while overlaid line plots represent the relative improvement of proposed models over a baseline. The chart demonstrates how model performance scales with more training data and highlights the effectiveness of the proposed methods ("Ours") compared to a baseline.
### Components/Axes
* **X-Axis (Bottom):** Labeled **"Training Samples"**. It has five categorical groups: **10k, 25k, 50k, 75k, 100k**.
* **Primary Y-Axis (Left):** Labeled **"Accuracy (%)"**. Scale ranges from 20 to 100, with major gridlines at 20, 40, 60, 80, 100.
* **Secondary Y-Axis (Right):** Labeled **"Relative Improvement over Baseline (%)"**. Scale ranges from 0 to 150, with major ticks at 0, 30, 60, 90, 120, 150.
* **Legend 1 (Top-Right):** Titled **"Model Performance"**. It defines the bar colors:
* **Baseline:** Dark slate blue/grey.
* **Ours (0.2):** Light yellow/beige.
* **Ours (0.4):** Light orange/peach.
* **Ours (0.6):** Muted red/terracotta.
* **Legend 2 (Bottom-Right):** Titled **"Sample Size (Lines)"**. It defines the line plot colors and markers, corresponding to the x-axis groups:
* **10k:** Red line with circle markers.
* **25k:** Blue line with circle markers.
* **50k:** Green line with circle markers.
* **75k:** Purple line with circle markers.
* **100k:** Orange line with circle markers.
* **Data Labels:** Numerical accuracy values are printed directly above each bar.
### Detailed Analysis
**Bar Chart Data (Accuracy %):**
The values are extracted by matching the bar color to the "Model Performance" legend and reading the label above it.
* **10k Training Samples:**
* Baseline: 38.3%
* Ours (0.2): 70.0%
* Ours (0.4): 84.7%
* Ours (0.6): 78.8%
* **25k Training Samples:**
* Baseline: 80.0%
* Ours (0.2): 87.8%
* Ours (0.4): 90.1%
* Ours (0.6): 82.2%
* **50k Training Samples:**
* Baseline: 83.8%
* Ours (0.2): 90.4%
* Ours (0.4): 92.3%
* Ours (0.6): 88.4%
* **75k Training Samples:**
* Baseline: 87.7%
* Ours (0.2): 92.1%
* Ours (0.4): 92.0%
* Ours (0.6): 90.9%
* **100k Training Samples:**
* Baseline: 91.9%
* Ours (0.2): 92.7%
* Ours (0.4): 94.9%
* Ours (0.6): 92.2%
**Line Plot Data (Relative Improvement over Baseline %):**
The lines connect points representing the improvement of each "Ours" variant over the baseline for that sample size. The y-values are read from the right-hand axis. The trend for each line is described first, followed by approximate point values.
* **10k Line (Red):** Shows a sharp peak. Starts near 0% for Ours (0.2), spikes to a high value for Ours (0.4), then drops for Ours (0.6).
* Ours (0.2): ~0% (point is on the 0% baseline)
* Ours (0.4): ~120% (peak, aligns with the 120 tick)
* Ours (0.6): ~105% (approximate, between 90 and 120)
* **25k Line (Blue):** Shows a moderate peak. Starts low, rises to a peak for Ours (0.4), then falls.
* Ours (0.2): ~0%
* Ours (0.4): ~15% (approximate)
* Ours (0.6): ~3% (approximate, just above 0)
* **50k Line (Green):** Shows a small, broad peak.
* Ours (0.2): ~0%
* Ours (0.4): ~10% (approximate)
* Ours (0.6): ~5% (approximate)
* **75k Line (Purple):** Shows a very slight, flat peak.
* Ours (0.2): ~0%
* Ours (0.4): ~5% (approximate)
* Ours (0.6): ~4% (approximate)
* **100k Line (Orange):** Shows minimal variation, hovering near zero.
* Ours (0.2): ~0%
* Ours (0.4): ~3% (approximate)
* Ours (0.6): ~0%
### Key Observations
1. **Accuracy Scaling:** All models show improved accuracy with more training samples. The baseline shows the most dramatic relative gain, moving from 38.3% at 10k to 91.9% at 100k.
2. **Model Superiority:** The "Ours" models consistently outperform the baseline at every sample size. The "Ours (0.4)" variant achieves the highest accuracy in four out of five groups (peaking at 94.9% with 100k samples).
3. **Diminishing Returns:** The relative improvement of "Ours" over the baseline is most pronounced at the smallest dataset size (10k), where the baseline performs poorly. As the baseline accuracy improves with more data, the *relative* gain from the proposed methods shrinks significantly, approaching near-zero improvement at 100k samples.
4. **Parameter Sensitivity:** The performance of "Ours" is sensitive to the parameter (0.2, 0.4, 0.6). The 0.4 setting appears optimal, yielding the highest accuracy in most cases. The 0.6 setting often underperforms the 0.4 setting.
### Interpretation
This chart tells a story about **data efficiency and model robustness**. The proposed methods ("Ours") are not just marginally better; they are dramatically more **data-efficient**. At 10k samples, they achieve accuracy levels (70-85%) that the baseline only reaches with 25k-50k samples. This suggests the new methods learn more effectively from limited data.
The converging trends at 100k samples indicate a **performance ceiling**. As the dataset becomes very large, the advantage of the advanced methods diminishes because the baseline model, given enough data, can also learn the task well. The key value proposition of "Ours" is therefore strongest in **low-data regimes**, making it highly valuable for applications where collecting labeled data is expensive or time-consuming.
The parameter sweep (0.2, 0.4, 0.6) indicates an optimal complexity or regularization point (0.4). Setting it too low (0.2) may underfit, while setting it too high (0.6) may introduce noise or over-constrain the model, leading to suboptimal performance. The chart effectively argues for the adoption of the "Ours (0.4)" model, especially when training data is limited.