# Technical Data Extraction: MoSe2 Current Density and Flow Maps
This document provides a detailed technical extraction of the data contained in the provided image, which consists of two side-by-side scientific plots (labeled 'e' and 'f') representing physical simulations of MoSe2.
## 1. General Metadata
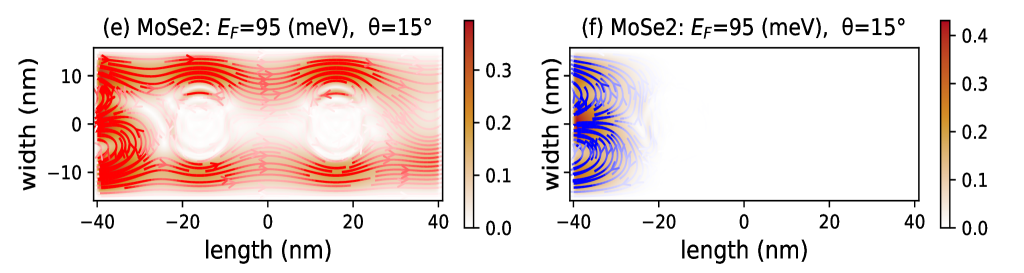
* **Material:** MoSe2 (Molybdenum diselenide)
* **Fermi Energy ($E_F$):** 95 (meV)
* **Angle ($\theta$):** 15°
* **Language:** English
---
## 2. Component Isolation: Plot (e)
### Header Information
* **Label:** (e)
* **Title:** MoSe2: $E_F=95$ (meV), $\theta=15°$
### Axis and Scale
* **X-axis (Horizontal):** labeled "length (nm)". Range: -40 to 40. Major ticks at -40, -20, 0, 20, 40.
* **Y-axis (Vertical):** labeled "width (nm)". Range: -15 to 15. Major ticks at -10, 0, 10.
* **Color Bar (Right):** Vertical scale representing a magnitude (likely current density). Range: 0.0 to >0.3. Ticks at 0.0, 0.1, 0.2, 0.3. Color gradient: Light cream (0.0) to Dark Red (~0.4).
### Data Visualization & Trends
* **Type:** Streamline plot overlaid on a heatmap.
* **Heatmap Trend:** The intensity is highest (dark red) along the top and bottom edges of the channel (approx. $y = \pm 10$ nm) and at the left entrance ($x = -40$ nm). There are two distinct circular "voids" or low-intensity regions (white) centered at approximately $x = -15, y = 0$ and $x = 15, y = 0$.
* **Streamline Flow:**
* Flow enters from the left ($x = -40$).
* The streamlines exhibit turbulent or vortex-like behavior near the left boundary.
* As the flow moves right, it splits to go around the two central low-intensity circular regions.
* The flow is most laminar and concentrated (indicated by darker red streamlines) in the regions between the central voids and the outer boundaries ($y \approx \pm 10$).
---
## 3. Component Isolation: Plot (f)
### Header Information
* **Label:** (f)
* **Title:** MoSe2: $E_F=95$ (meV), $\theta=15°$
### Axis and Scale
* **X-axis (Horizontal):** labeled "length (nm)". Range: -40 to 40. Major ticks at -40, -20, 0, 20, 40.
* **Y-axis (Vertical):** labeled "width (nm)". Range: -15 to 15. Major ticks at -10, 0, 10.
* **Color Bar (Right):** Vertical scale. Range: 0.0 to >0.4. Ticks at 0.0, 0.1, 0.2, 0.3, 0.4. Color gradient: Light cream (0.0) to Dark Red (~0.45).
### Data Visualization & Trends
* **Type:** Vector/Streamline plot with localized heatmap.
* **Heatmap Trend:** Unlike plot (e), the data in plot (f) is heavily concentrated at the left boundary ($x = -40$ to $x \approx -20$). The rest of the plot ($x > -20$) is white, indicating zero or negligible values.
* **Streamline Flow:**
* The flow consists of two primary counter-rotating vortices located at the left edge.
* **Upper Vortex:** Centered around $y \approx 5$, rotating counter-clockwise.
* **Lower Vortex:** Centered around $y \approx -5$, rotating clockwise.
* The streamlines are colored blue, contrasting with the red/orange heatmap background at the very edge ($x = -40$).
* The flow appears to be "injected" at $y=0, x=-40$ and then curls back toward the corners at $x=-40, y=\pm 12$.
---
## 4. Comparative Summary
| Feature | Plot (e) | Plot (f) |
| :--- | :--- | :--- |
| **Spatial Coverage** | Full channel (-40 to 40 nm) | Left-loaded (-40 to -20 nm) |
| **Flow Pattern** | Channel flow bypassing two central obstacles | Two localized vortices at the injection point |
| **Max Intensity** | ~0.35 (distributed) | >0.4 (highly localized at $x=-40$) |
| **Symmetry** | Roughly symmetric across $y=0$ | Highly symmetric across $y=0$ |
**Note on Spatial Grounding:** The color bars for both plots are located at the far right of each respective sub-figure. In plot (e), the dark red streamlines at $y=10$ match the $\approx 0.3$ value on the legend. In plot (f), the dark orange/red patch at $x=-40, y=0$ matches the $\approx 0.4$ value on its respective legend.