## Line Chart: Attention Key Query Score Performance
### Overview
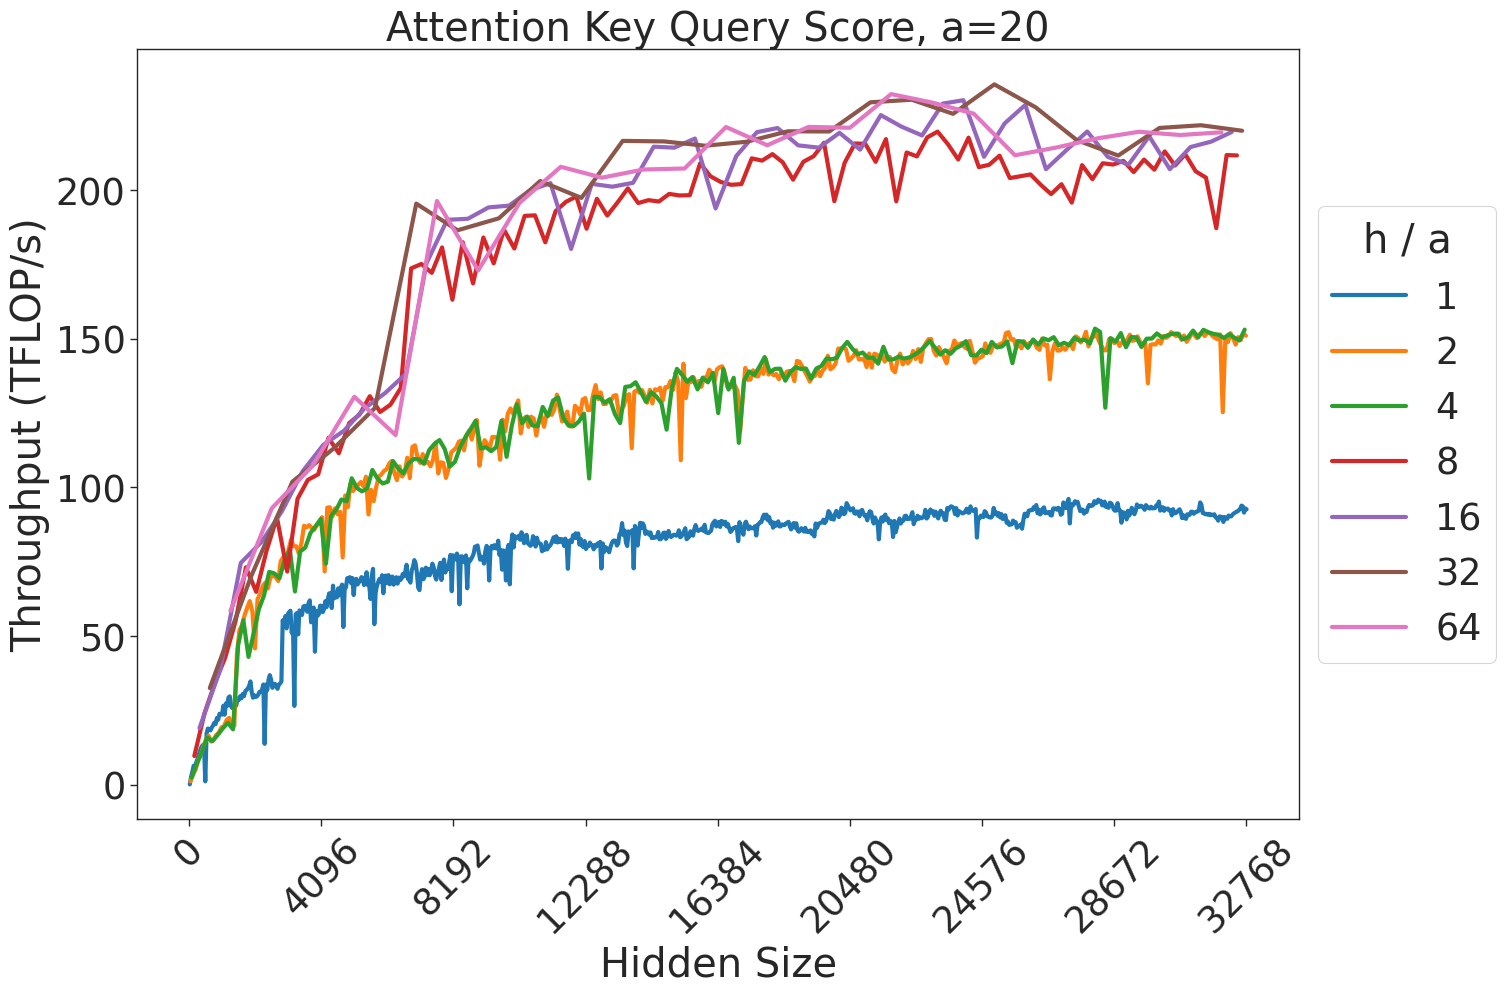
This chart illustrates the relationship between "Hidden Size" (x-axis) and "Throughput (TFLOP/s)" (y-axis) for various "h / a" ratios. The data demonstrates how computational throughput scales as the hidden size of the model increases, with distinct performance tiers emerging based on the "h / a" parameter.
### Components/Axes
* **Title:** "Attention Key Query Score, a=20" (Centered at the top).
* **Y-Axis:** "Throughput (TFLOP/s)". The scale ranges from 0 to slightly above 200, with major tick marks at 0, 50, 100, 150, and 200.
* **X-Axis:** "Hidden Size". The scale ranges from 0 to 32768, with major tick marks at 0, 4096, 8192, 12288, 16384, 20480, 24576, 28672, and 32768.
* **Legend:** Positioned on the right side of the chart. It maps "h / a" ratios to specific line colors:
* **Blue:** 1
* **Orange:** 2
* **Green:** 4
* **Red:** 8
* **Purple:** 16
* **Brown:** 32
* **Pink:** 64
### Detailed Analysis
The chart displays three distinct performance clusters based on the "h / a" ratio. All lines exhibit a similar trend: a steep, near-linear increase in throughput for smaller hidden sizes (0 to ~8192), followed by a gradual plateauing effect as the hidden size increases toward 32768.
* **Cluster 1 (Low Performance - Blue):**
* **Trend:** The blue line (h/a=1) is the lowest performer. It rises sharply from 0 to approximately 50 TFLOP/s at a hidden size of 4096.
* **Plateau:** It continues to rise slowly, plateauing at approximately 90–95 TFLOP/s for hidden sizes above 16384.
* **Cluster 2 (Mid Performance - Orange, Green):**
* **Trend:** The orange (h/a=2) and green (h/a=4) lines overlap significantly. They rise to approximately 100 TFLOP/s at a hidden size of 4096.
* **Plateau:** They plateau at approximately 150 TFLOP/s for hidden sizes above 16384.
* **Cluster 3 (High Performance - Red, Purple, Brown, Pink):**
* **Trend:** The red (h/a=8), purple (h/a=16), brown (h/a=32), and pink (h/a=64) lines are tightly clustered at the top. They rise sharply to approximately 175 TFLOP/s at a hidden size of 4096.
* **Plateau:** They plateau at approximately 220–230 TFLOP/s for hidden sizes above 16384.
* **Note:** There is significant high-frequency noise (jitter) in the lines, particularly in the lower hidden size ranges, indicating potential measurement variance or computational instability during the initial scaling phase.
### Key Observations
* **Saturation Point:** Regardless of the "h / a" ratio, throughput gains diminish significantly once the hidden size exceeds 16384.
* **Diminishing Returns:** Increasing the "h / a" ratio beyond 8 (i.e., moving from 8 to 16, 32, or 64) provides negligible improvements in throughput, as the red, purple, brown, and pink lines are nearly indistinguishable.
* **Performance Tiers:** The system exhibits clear "step-function" behavior where performance jumps to a higher tier as the "h / a" ratio increases, but these tiers are capped.
### Interpretation
The data suggests that the "h / a" ratio is a critical hyperparameter for optimizing throughput, but only up to a point.
1. **Optimal Configuration:** An "h / a" ratio of 8 appears to be the "sweet spot." It achieves the maximum performance tier (approx. 220-230 TFLOP/s). Increasing the ratio further (to 16, 32, or 64) does not yield meaningful throughput gains, suggesting that the computational overhead or memory bandwidth limits are reached at h/a=8.
2. **Bottlenecking:** The plateau observed across all lines suggests that the system hits a hardware or memory bandwidth bottleneck as the hidden size increases. Once the hidden size is large enough (roughly 16384+), the throughput is constrained by the hardware's maximum capacity rather than the model's configuration.
3. **Efficiency:** For smaller models (hidden size < 8192), the choice of "h / a" is highly impactful. For larger models, the choice of "h / a" (provided it is 8 or higher) is less critical for throughput, as the system is likely saturated.