## Line Graphs: Performance Metrics Across Interleaving Percentages
### Overview
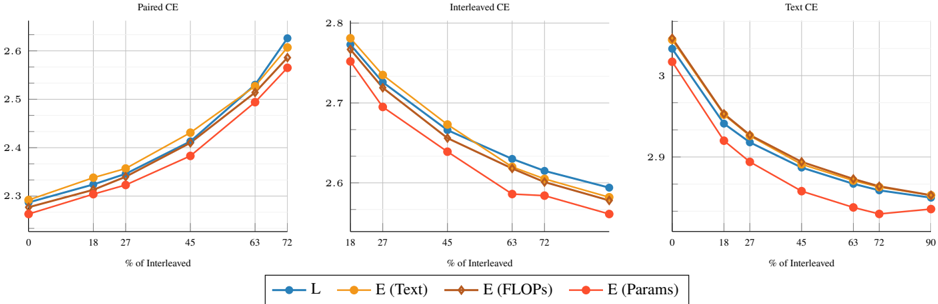
The image contains three line graphs titled "Paired CE," "Interleaved CE," and "Text CE," each plotting performance metrics (L, E (Text), E (FLOPs), E (Params)) against "% of Interleaved" (0–90%). The graphs show trends in how these metrics change as the percentage of interleaved data increases.
---
### Components/Axes
- **X-axis**: "% of Interleaved" (0–90% in all graphs).
- **Y-axis**: Performance metric values (approximate ranges: 2.3–3.0).
- **Legends**:
- **L** (blue line)
- **E (Text)** (orange line)
- **E (FLOPs)** (brown line)
- **E (Params)** (red line)
- **Graph Titles**:
- **Paired CE** (left)
- **Interleaved CE** (center)
- **Text CE** (right)
---
### Detailed Analysis
#### **Paired CE**
- **Trend**: All metrics increase as "% of Interleaved" rises.
- **Data Points**:
- **L**: 2.3 (0%) → 2.6 (72%)
- **E (Text)**: 2.3 (0%) → 2.6 (72%)
- **E (FLOPs)**: 2.3 (0%) → 2.6 (72%)
- **E (Params)**: 2.3 (0%) → 2.6 (72%)
- **Key Observations**:
- All metrics show a consistent upward trend.
- **E (Params)** ends highest (2.6 at 72%), followed by **E (FLOPs)**, **E (Text)**, and **L**.
#### **Interleaved CE**
- **Trend**: All metrics decrease as "% of Interleaved" rises.
- **Data Points**:
- **L**: 2.8 (18%) → 2.6 (90%)
- **E (Text)**: 2.8 (18%) → 2.6 (90%)
- **E (FLOPs)**: 2.75 (18%) → 2.5 (90%)
- **E (Params)**: 2.7 (18%) → 2.5 (90%)
- **Key Observations**:
- All metrics decline steadily.
- **E (Params)** drops the most sharply (from 2.7 to 2.5).
#### **Text CE**
- **Trend**: All metrics decrease as "% of Interleaved" rises.
- **Data Points**:
- **L**: 3.0 (0%) → 2.7 (90%)
- **E (Text)**: 3.0 (0%) → 2.7 (90%)
- **E (FLOPs)**: 3.0 (0%) → 2.65 (90%)
- **E (Params)**: 3.0 (0%) → 2.65 (90%)
- **Key Observations**:
- All metrics start at 3.0 and decline to ~2.7.
- **E (Params)** and **E (FLOPs)** show the steepest declines.
---
### Key Observations
1. **Paired CE** shows **positive correlation** between interleaving and performance.
2. **Interleaved CE** and **Text CE** show **negative correlation**, with metrics declining as interleaving increases.
3. **E (Params)** consistently exhibits the most significant changes (highest increases in Paired CE, steepest declines in Interleaved/CE).
4. **L** (blue line) remains relatively stable compared to other metrics in all graphs.
---
### Interpretation
- **Paired CE**: Higher interleaving improves performance, suggesting that interleaving enhances the model's ability to handle paired data.
- **Interleaved CE/Text CE**: Higher interleaving degrades performance, indicating potential overfitting or inefficiency in handling interleaved data.
- **Metric Differences**:
- **E (Params)** is the most sensitive to interleaving changes, possibly reflecting computational complexity or parameter efficiency.
- **L** (blue line) shows the least variability, suggesting it is less affected by interleaving.
- **Implications**: The choice of interleaving strategy (paired vs. interleaved vs. text) and the metric type (e.g., FLOPs, parameters) significantly impact performance outcomes. This highlights the need for context-specific optimization.
---
**Note**: All values are approximate, with uncertainty due to visual estimation from the graph.