\n
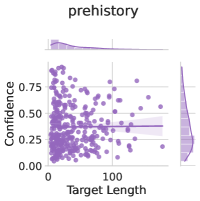
## Scatter Plot: Confidence vs. Target Length (Prehistory)
### Overview
The image presents a scatter plot visualizing the relationship between "Target Length" and "Confidence" for the category "prehistory". A regression line with a shaded confidence interval is overlaid on the scatter points. The plot suggests a very weak or non-existent linear relationship between the two variables.
### Components/Axes
* **Title:** "prehistory" (positioned at the top-center)
* **X-axis:** "Target Length" (ranging from approximately 0 to 150, with tick marks at 0, 50, 100, 150)
* **Y-axis:** "Confidence" (ranging from approximately 0.00 to 0.75, with tick marks at 0.00, 0.25, 0.50, 0.75)
* **Data Points:** Numerous purple dots scattered across the plot area.
* **Regression Line:** A purple line representing the trend of the data.
* **Confidence Interval:** A shaded purple area around the regression line, indicating the uncertainty in the estimated trend.
### Detailed Analysis
The scatter plot shows a large number of data points (approximately 300-400) distributed across the plot area. The points appear relatively randomly scattered, with no clear clustering or pattern.
* **Regression Line Trend:** The regression line is nearly horizontal, indicating a very slight negative slope. This suggests that as "Target Length" increases, "Confidence" tends to decrease very slightly.
* **Data Point Distribution:** The majority of data points fall within the "Confidence" range of 0.10 to 0.60. There are fewer points with "Confidence" values above 0.60.
* **Approximate Data Points (sampled):**
* Target Length = 0, Confidence ≈ 0.20 - 0.50 (multiple points)
* Target Length = 50, Confidence ≈ 0.20 - 0.50 (multiple points)
* Target Length = 100, Confidence ≈ 0.15 - 0.55 (multiple points)
* Target Length = 150, Confidence ≈ 0.10 - 0.40 (multiple points)
* **Confidence Interval:** The confidence interval is relatively wide, indicating a high degree of uncertainty in the estimated regression line.
### Key Observations
* The correlation between "Target Length" and "Confidence" appears to be very weak.
* The data is highly dispersed, with a large amount of variability in "Confidence" for any given "Target Length".
* The confidence interval is wide, suggesting that the estimated regression line is not very precise.
### Interpretation
The plot suggests that "Target Length" is not a strong predictor of "Confidence" within the "prehistory" category. The lack of a clear trend and the wide confidence interval indicate that other factors likely play a more significant role in determining "Confidence". The data could be interpreted as showing that the model's confidence is largely independent of the target length for this category. The horizontal regression line suggests a very slight negative correlation, but this is likely not statistically significant given the wide confidence interval and the overall scatter of the data. It's possible that the model struggles to accurately assess confidence for targets of any length within the "prehistory" domain.