\n
## Bar Chart: Performance Comparison of Binaural Filtering Algorithms
### Overview
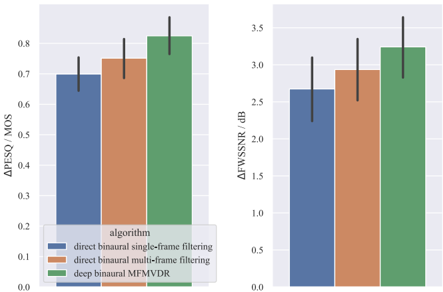
This image presents a comparative analysis of three binaural filtering algorithms using two different metrics: ΔPESQ / MOS (left chart) and ΔFWSSNR / dB (right chart). The algorithms are: direct binaural single-frame filtering, direct binaural multi-frame filtering, and deep binaural MFMVDR. Each bar represents the mean performance of an algorithm, with error bars indicating the variability.
### Components/Axes
* **X-axis (Both Charts):** "algorithm" with categories: "direct binaural single-frame filtering", "direct binaural multi-frame filtering", and "deep binaural MFMVDR".
* **Y-axis (Left Chart):** "ΔPESQ / MOS". Scale ranges from 0.0 to 0.9, with increments of 0.1.
* **Y-axis (Right Chart):** "ΔFWSSNR / dB". Scale ranges from 0.0 to 3.5, with increments of 0.5.
* **Legend (Bottom-Left):**
* Blue: "direct binaural single-frame filtering"
* Orange: "direct binaural multi-frame filtering"
* Green: "deep binaural MFMVDR"
### Detailed Analysis or Content Details
**Left Chart (ΔPESQ / MOS):**
* **Direct Binaural Single-Frame Filtering (Blue):** The bar is approximately 0.72 ± 0.08. The bar rises to approximately 0.72, with the top of the error bar reaching around 0.80 and the bottom around 0.64.
* **Direct Binaural Multi-Frame Filtering (Orange):** The bar is approximately 0.75 ± 0.07. The bar rises to approximately 0.75, with the top of the error bar reaching around 0.82 and the bottom around 0.68.
* **Deep Binaural MFMVDR (Green):** The bar is approximately 0.83 ± 0.06. The bar rises to approximately 0.83, with the top of the error bar reaching around 0.89 and the bottom around 0.77.
**Right Chart (ΔFWSSNR / dB):**
* **Direct Binaural Single-Frame Filtering (Blue):** The bar is approximately 2.6 ± 0.5. The bar rises to approximately 2.6, with the top of the error bar reaching around 3.1 and the bottom around 2.1.
* **Direct Binaural Multi-Frame Filtering (Orange):** The bar is approximately 3.0 ± 0.4. The bar rises to approximately 3.0, with the top of the error bar reaching around 3.4 and the bottom around 2.6.
* **Deep Binaural MFMVDR (Green):** The bar is approximately 3.2 ± 0.5. The bar rises to approximately 3.2, with the top of the error bar reaching around 3.7 and the bottom around 2.7.
### Key Observations
* In both charts, the "deep binaural MFMVDR" algorithm consistently demonstrates the highest mean performance.
* The "direct binaural multi-frame filtering" algorithm outperforms the "direct binaural single-frame filtering" algorithm in both metrics.
* The error bars indicate that the variability in performance is relatively similar across all algorithms for both metrics.
* The PESQ metric shows smaller differences between algorithms than the FWSSNR metric.
### Interpretation
The data suggests that the "deep binaural MFMVDR" algorithm provides the best performance in terms of both perceptual quality (ΔPESQ / MOS) and signal-to-noise ratio (ΔFWSSNR / dB) compared to the direct filtering methods. The improvement from single-frame to multi-frame filtering indicates that incorporating temporal information enhances performance. The larger differences observed in the FWSSNR metric suggest that the deep learning approach has a more significant impact on reducing noise and improving signal clarity than on directly improving perceived audio quality. The error bars suggest that the observed differences are statistically meaningful, but there is still some variability in the results. This could be due to variations in the input data or the specific implementation of the algorithms. The charts provide a clear quantitative comparison of the effectiveness of different binaural filtering techniques.