\n
## Chart: L0 over Training Steps
### Overview
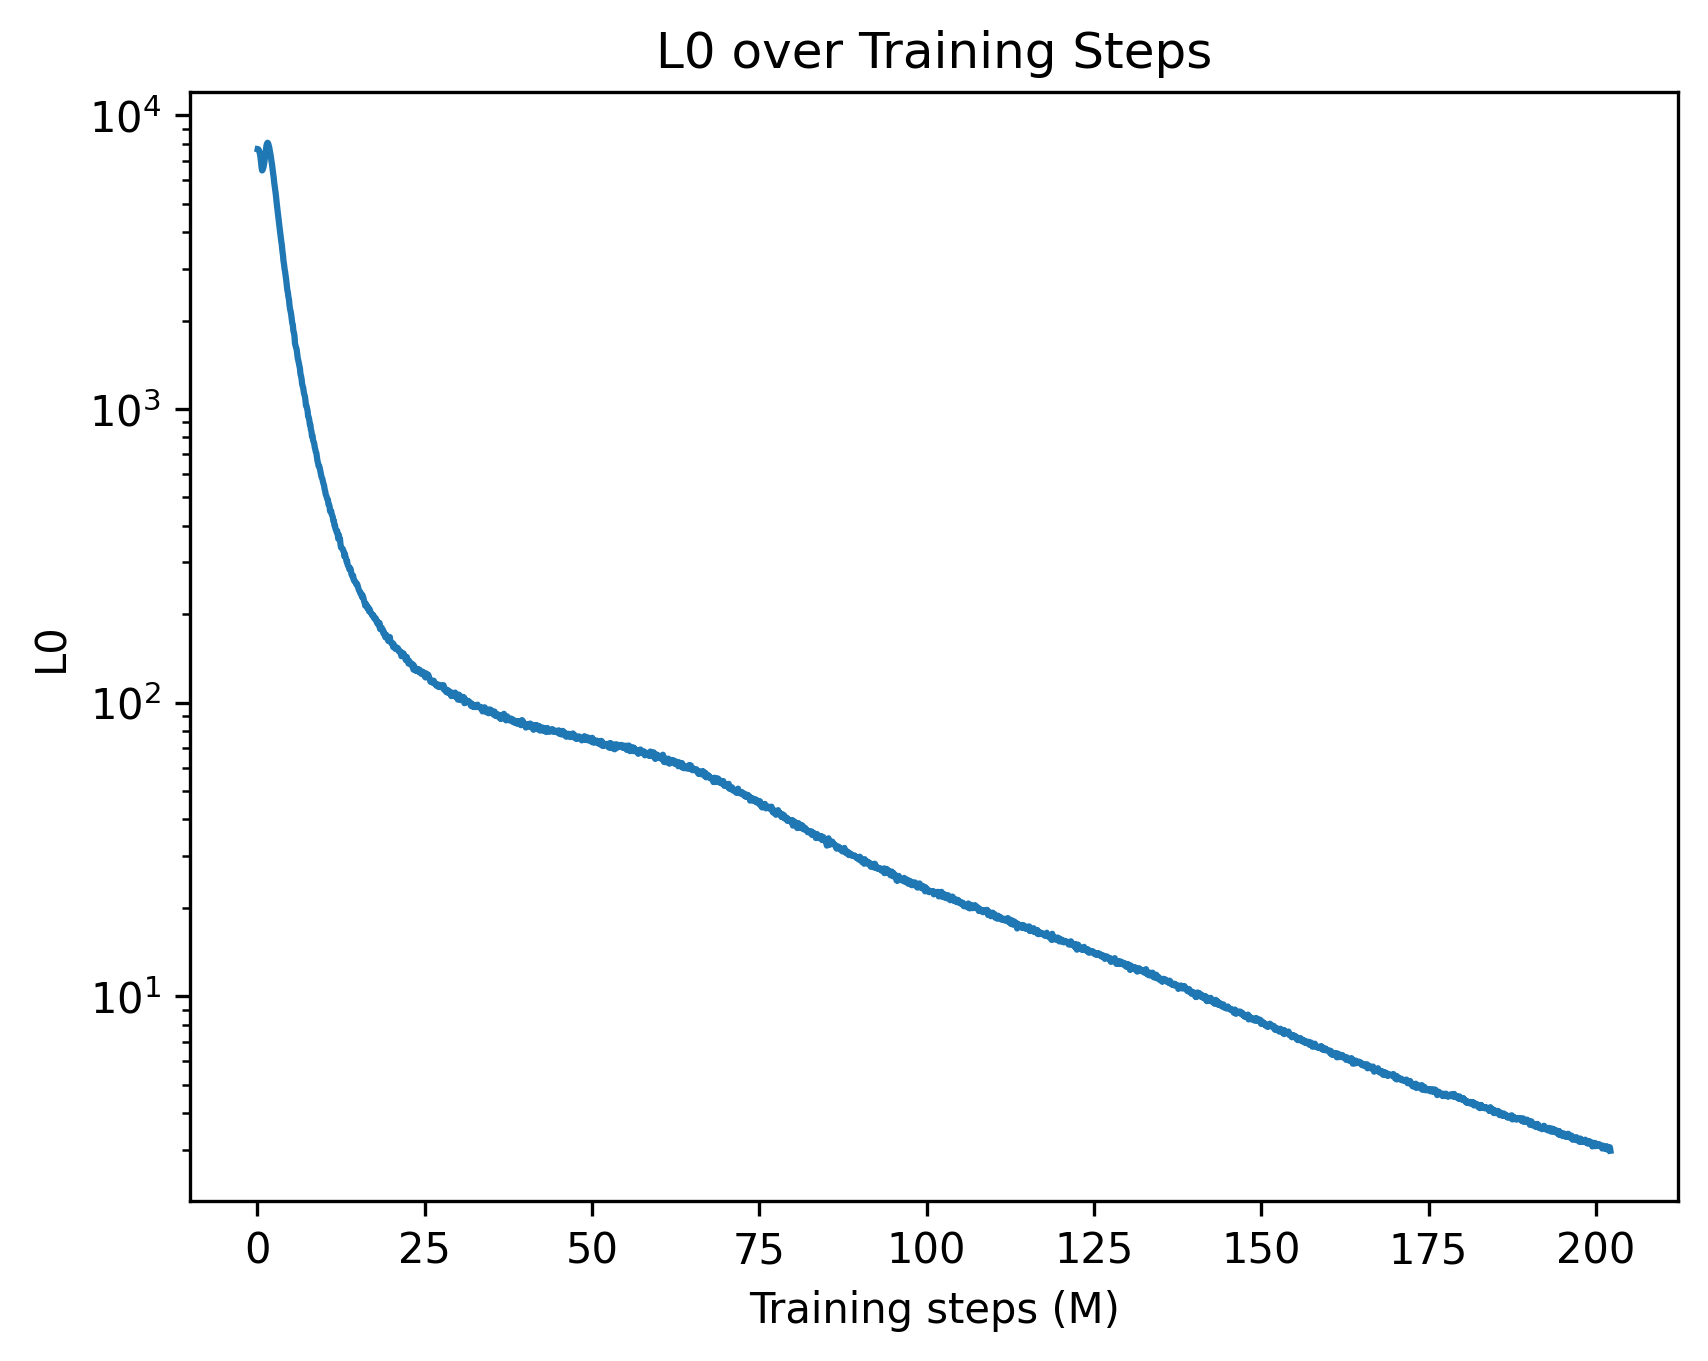
The image presents a line chart illustrating the relationship between L0 and Training Steps (in millions). The chart shows a decreasing trend, indicating that L0 decreases as the number of training steps increases. The y-axis is displayed on a logarithmic scale.
### Components/Axes
* **Title:** "L0 over Training Steps" - positioned at the top-center of the chart.
* **X-axis:** "Training steps (M)" - positioned at the bottom-center of the chart. The scale ranges from 0 to 200, with tick marks at intervals of 25.
* **Y-axis:** "L0" - positioned on the left side of the chart. The scale is logarithmic, ranging from 1 to 10,000 (10^4). Tick marks are displayed at 1, 10, 100, 1000, and 10000.
* **Data Series:** A single blue line representing the L0 value over training steps.
### Detailed Analysis
The blue line starts at approximately (0, 10,000) and exhibits a steep downward slope initially. The slope gradually decreases as the training steps increase.
Here's an approximate reconstruction of data points:
* (0, ~10,000)
* (25, ~100)
* (50, ~20)
* (75, ~10)
* (100, ~8)
* (125, ~7)
* (150, ~6)
* (175, ~5)
* (200, ~4)
The line demonstrates a rapid decrease in L0 during the first 25 million training steps, followed by a slower, more gradual decrease. The curve appears to be approaching an asymptote, suggesting that L0 is converging towards a stable value.
### Key Observations
* The logarithmic scale on the y-axis emphasizes the initial rapid decrease in L0.
* The decreasing trend suggests that the training process is effectively reducing the L0 norm, potentially indicating improved model generalization or sparsity.
* The flattening of the curve towards the end of the training period suggests diminishing returns from further training.
### Interpretation
This chart likely represents the evolution of an L0 regularization term during the training of a machine learning model. L0 regularization encourages sparsity in the model's weights, effectively selecting a subset of important features. The decreasing L0 value indicates that the model is becoming increasingly sparse as training progresses.
The initial steep decline suggests that the model quickly identifies and eliminates many unimportant features. The subsequent slower decline indicates that the remaining features are more difficult to prune, potentially because they contribute more significantly to the model's performance.
The convergence of the L0 value towards a stable level suggests that the model has reached a point where further sparsity is unlikely to improve performance. This could be due to the remaining features being essential for accurate predictions or due to the limitations of the regularization strength.
The use of a logarithmic scale is crucial for visualizing the data effectively, as it allows for the clear representation of both the initial rapid decrease and the subsequent slower decline in L0. Without the logarithmic scale, the initial decrease would dominate the visualization, obscuring the later stages of the training process.