## Grouped Bar Chart: Accuracy Comparison of Three Methods Across Two Metrics
### Overview
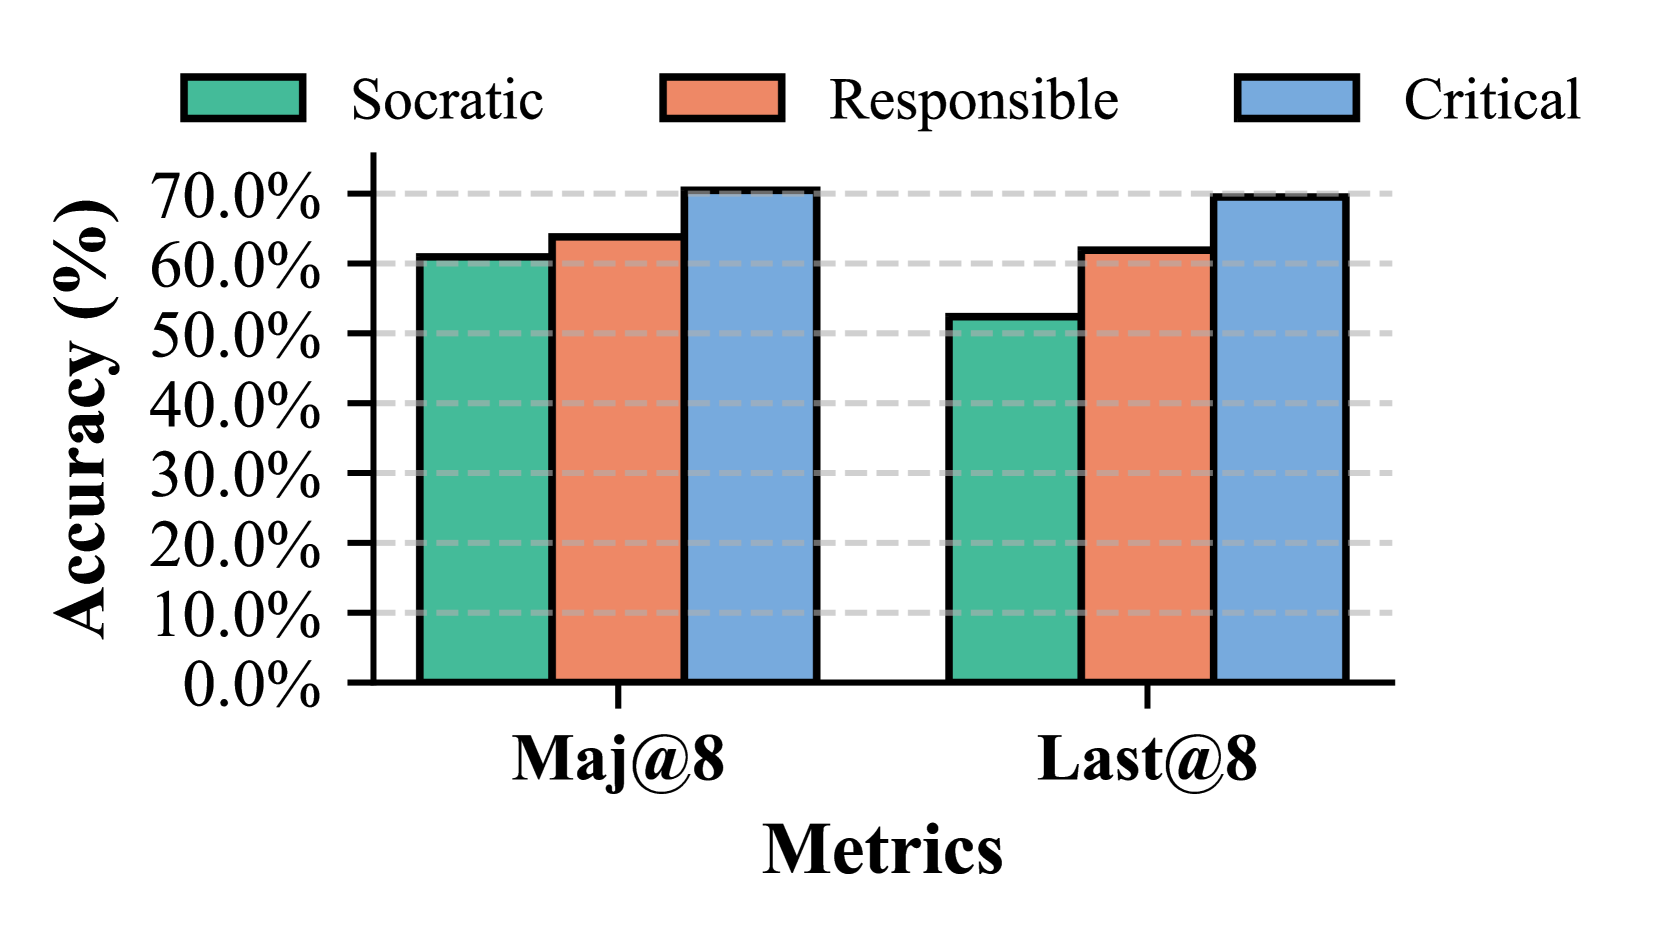
The image displays a grouped bar chart comparing the accuracy percentages of three different methods—Socratic, Responsible, and Critical—across two evaluation metrics: "Maj@8" and "Last@8". The chart is designed to visually contrast the performance of these methods.
### Components/Axes
* **Chart Type:** Grouped Bar Chart.
* **Y-Axis:**
* **Label:** "Accuracy (%)".
* **Scale:** Linear scale from 0.0% to 70.0%, with major tick marks and grid lines at every 10% increment (0.0%, 10.0%, 20.0%, 30.0%, 40.0%, 50.0%, 60.0%, 70.0%).
* **X-Axis:**
* **Label:** "Metrics".
* **Categories:** Two primary categories are displayed: "Maj@8" (left group) and "Last@8" (right group).
* **Legend:**
* **Position:** Centered at the top of the chart area.
* **Items:**
1. **Socratic:** Represented by a teal/green colored bar.
2. **Responsible:** Represented by an orange/salmon colored bar.
3. **Critical:** Represented by a light blue colored bar.
* **Data Series:** Each metric category ("Maj@8", "Last@8") contains three adjacent bars, one for each method, ordered from left to right as Socratic, Responsible, Critical.
### Detailed Analysis
**Metric: Maj@8 (Left Group)**
* **Socratic (Teal Bar):** The bar height indicates an accuracy of approximately **61%**. It is the shortest bar in this group.
* **Responsible (Orange Bar):** The bar height indicates an accuracy of approximately **64%**. It is taller than the Socratic bar but shorter than the Critical bar.
* **Critical (Blue Bar):** The bar height indicates an accuracy of approximately **71%**. It is the tallest bar in this group, slightly exceeding the 70.0% grid line.
**Metric: Last@8 (Right Group)**
* **Socratic (Teal Bar):** The bar height indicates an accuracy of approximately **53%**. It is the shortest bar in this group and notably shorter than its counterpart in the Maj@8 group.
* **Responsible (Orange Bar):** The bar height indicates an accuracy of approximately **62%**. It is taller than the Socratic bar but shorter than the Critical bar.
* **Critical (Blue Bar):** The bar height indicates an accuracy of approximately **70%**. It is the tallest bar in this group, aligning closely with the 70.0% grid line.
### Key Observations
1. **Consistent Performance Hierarchy:** Across both metrics, the "Critical" method achieves the highest accuracy, followed by "Responsible," with "Socratic" performing the lowest.
2. **Metric-Dependent Performance Drop:** All three methods show a decrease in accuracy when moving from the "Maj@8" metric to the "Last@8" metric. The drop is most pronounced for the "Socratic" method (from ~61% to ~53%, an ~8 percentage point decrease).
3. **Relative Stability of "Critical":** The "Critical" method exhibits the smallest performance drop between metrics (from ~71% to ~70%, a ~1 percentage point decrease), suggesting it is the most robust across these two evaluation criteria.
4. **"Responsible" Method Consistency:** The "Responsible" method maintains a middle position with a moderate drop (from ~64% to ~62%, a ~2 percentage point decrease).
### Interpretation
This chart presents a performance benchmark likely from an AI or machine learning study, comparing different prompting or reasoning strategies ("Socratic," "Responsible," "Critical"). The metrics "Maj@8" and "Last@8" are common in evaluating large language models, often referring to majority-vote accuracy and the accuracy of the final answer in a sequence of eight attempts, respectively.
The data suggests that the **"Critical" strategy is the most effective and robust** of the three, yielding the highest accuracy on both metrics and showing minimal sensitivity to the change in evaluation method. The **"Socratic" strategy, while potentially useful, is the least accurate and most sensitive** to the metric used, performing significantly worse on "Last@8." This could imply that the Socratic method's final answer is less reliable than its aggregated majority vote. The **"Responsible" strategy offers a middle ground**, providing better accuracy than Socratic but not reaching the level of Critical.
The consistent ranking across metrics indicates a fundamental difference in the efficacy of these methods for the task being measured. The chart effectively communicates that for maximizing accuracy, especially when considering the final output ("Last@8"), the "Critical" approach is superior.