\n
## Scatter Plot: Confidence vs. Target Length (Virology)
### Overview
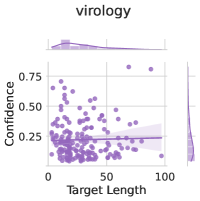
The image presents a scatter plot visualizing the relationship between "Target Length" and "Confidence" in the context of virology. A regression line with a shaded confidence interval is overlaid on the scatter points. The plot appears to show a weak or non-existent linear relationship between the two variables.
### Components/Axes
* **Title:** "virology" (top-center)
* **X-axis:** "Target Length" (bottom-center), ranging from approximately 0 to 100. The axis is divided into major ticks at 0, 50, and 100.
* **Y-axis:** "Confidence" (left-center), ranging from approximately 0 to 0.75. The axis is divided into major ticks at 0, 0.25, 0.50, and 0.75.
* **Data Points:** Numerous purple circles representing individual data points.
* **Regression Line:** A purple line representing the trend of the data.
* **Confidence Interval:** A shaded purple area around the regression line, indicating the uncertainty in the estimated trend.
* **Histograms:** Two histograms are present on the right and top of the scatter plot, showing the distribution of "Target Length" and "Confidence" respectively.
### Detailed Analysis
The scatter plot shows a large number of data points distributed across the range of "Target Length" (0-100) and "Confidence" (0-0.75).
* **Regression Line Trend:** The regression line has a very slight negative slope, suggesting a very weak negative correlation between "Target Length" and "Confidence".
* **Data Point Distribution:** The majority of data points cluster between "Confidence" values of 0.1 and 0.3, regardless of the "Target Length".
* **Target Length Histogram:** The histogram at the top shows a concentration of data points at lower "Target Length" values (around 0-20), with a decreasing frequency as "Target Length" increases. The histogram appears to be normalized.
* **Confidence Histogram:** The histogram on the right shows a concentration of data points at lower "Confidence" values (around 0.1-0.3), with a decreasing frequency as "Confidence" increases. The histogram appears to be normalized.
Let's attempt to extract some approximate data points from the scatter plot:
* At Target Length = 0, Confidence ranges from approximately 0.1 to 0.7.
* At Target Length = 50, Confidence ranges from approximately 0.1 to 0.4.
* At Target Length = 100, Confidence ranges from approximately 0.1 to 0.3.
* The regression line appears to start at approximately (0, 0.27) and end at approximately (100, 0.22).
### Key Observations
* There is a very weak negative correlation between "Target Length" and "Confidence".
* The "Confidence" values are generally low, with most points falling below 0.5.
* The distribution of "Target Length" is skewed towards lower values.
* The histograms suggest that both "Target Length" and "Confidence" are not normally distributed.
### Interpretation
The data suggests that "Target Length" is not a strong predictor of "Confidence" in this virology context. The low "Confidence" values across all "Target Lengths" might indicate inherent difficulties in obtaining high confidence scores for this type of analysis, or that the method used to calculate confidence is inherently conservative. The slight negative trend could indicate that longer target lengths are *slightly* associated with lower confidence, but the effect is minimal. The histograms reveal that the data is not evenly distributed, which could influence the regression analysis. Further investigation would be needed to understand the underlying reasons for these observations and to determine the practical implications of this relationship. The title "virology" suggests this data relates to viral sequence analysis, potentially assessing the confidence in identifying viral targets based on their length.