## Line Graph: Head Proportions through Global RMS Selection By Article
### Overview
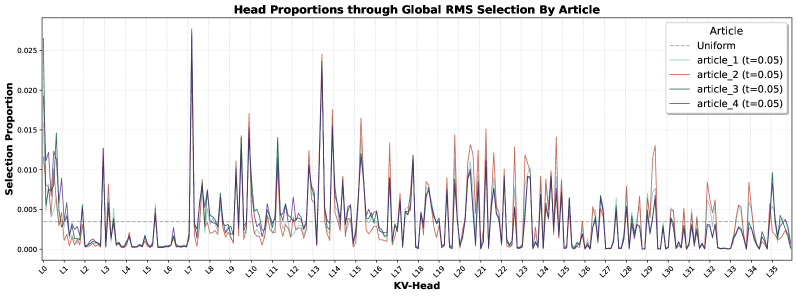
The image is a line graph visualizing the selection proportions of different articles across 36 KV-Heads (labeled L0 to L35). Four data series (article_1 to article_4) are plotted alongside a dashed "Uniform" baseline. The y-axis represents selection proportion (0.000–0.025), while the x-axis represents KV-Heads. The graph shows significant variability in selection proportions across articles and KV-Heads.
### Components/Axes
- **X-Axis (KV-Head)**: Labeled "KV-Head" with discrete markers L0 to L35.
- **Y-Axis (Selection Proportion)**: Labeled "Selection Proportion" with a scale from 0.000 to 0.025 in increments of 0.005.
- **Legend**: Located in the top-right corner, with four colored lines:
- Dashed gray: "Uniform"
- Light blue: "article_1 (t=0.05)"
- Red: "article_2 (t=0.05)"
- Green: "article_3 (t=0.05)"
- Purple: "article_4 (t=0.05)"
- **Lines**: Four solid-colored lines (light blue, red, green, purple) and one dashed gray line.
### Detailed Analysis
1. **Uniform Baseline**: The dashed gray line remains flat at approximately 0.005 across all KV-Heads, serving as a reference point.
2. **Article_1 (Light Blue)**:
- Peaks at L7 (~0.020), L14 (~0.018), and L25 (~0.015).
- Troughs near L20 (~0.003) and L30 (~0.002).
3. **Article_2 (Red)**:
- Sharpest peak at L7 (~0.025), the highest value in the graph.
- Secondary peaks at L14 (~0.022) and L25 (~0.018).
- Troughs near L20 (~0.004) and L30 (~0.003).
4. **Article_3 (Green)**:
- Peaks at L10 (~0.015), L20 (~0.012), and L30 (~0.010).
- Troughs near L5 (~0.002) and L25 (~0.003).
5. **Article_4 (Purple)**:
- Peaks at L7 (~0.022), L14 (~0.019), and L25 (~0.016).
- Troughs near L5 (~0.001) and L30 (~0.002).
### Key Observations
- **Highest Selection Proportion**: Article_2 at L7 (~0.025) exceeds all other values.
- **Uniform Baseline**: All articles fluctuate above and below the 0.005 baseline, indicating non-uniform selection.
- **Correlated Peaks**: Articles 1, 2, and 4 share prominent peaks at L7, L14, and L25, suggesting shared KV-Head importance.
- **Divergent Patterns**: Article_3 exhibits distinct peaks at L10, L20, and L30, differing from other articles.
- **Troughs**: All articles show minima near L20 and L30, with Article_4 having the lowest troughs (~0.001–0.002).
### Interpretation
The graph demonstrates that selection proportions vary significantly across KV-Heads and articles. The Uniform baseline (0.005) acts as a reference, showing that most articles exceed this value at specific KV-Heads. The shared peaks at L7, L14, and L25 suggest these KV-Heads are critical for multiple articles, while Article_3’s unique pattern highlights distinct selection dynamics. The extreme peak at L7 (article_2) indicates a disproportionately high selection rate at this KV-Head, potentially signaling an outlier or focal point in the selection process. The troughs near L20 and L30 may represent less influential KV-Heads or transitional regions in the selection mechanism. Overall, the data underscores the non-uniform and article-specific nature of KV-Head selection in the Global RMS framework.