\n
## Histograms: Battery State Over Time
### Overview
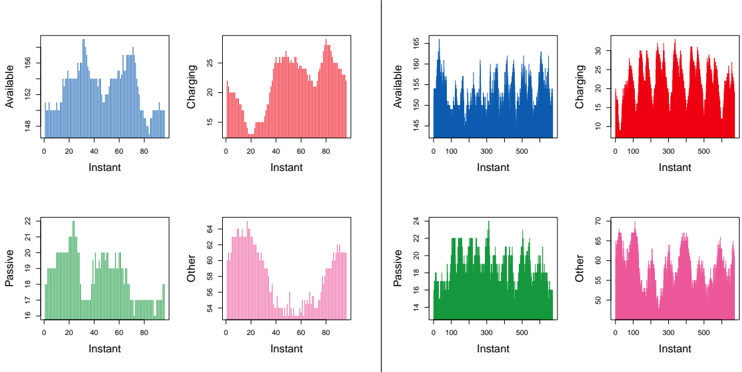
The image presents a 2x2 grid of histograms, each depicting the distribution of a battery state variable over time. The x-axis of each histogram represents "Instant" (likely a time step), ranging from 0 to approximately 90 in the left column and 0 to 500 in the right column. The y-axis represents the frequency or count of occurrences for each state. The four battery states are "Available", "Charging", "Passive", and "Other".
### Components/Axes
* **X-axis:** "Instant" - Represents time or a time step. Scale varies between the left and right columns.
* **Y-axis:** Frequency/Count - Represents the number of occurrences of a given state at a particular instant. Scale varies between the histograms.
* **Histograms:** Four histograms, each representing a different battery state.
* "Available" (Blue)
* "Charging" (Red)
* "Passive" (Green)
* "Other" (Pink)
### Detailed Analysis or Content Details
**Left Column (Instant 0-90):**
* **Available (Top-Left):** The histogram shows a roughly normal distribution, peaking around Instant 30. The frequency ranges from approximately 148 to 156.
* **Charging (Top-Right):** The histogram shows a decreasing trend, starting with a frequency around 25 at Instant 0 and decreasing to approximately 10 at Instant 90.
* **Passive (Bottom-Left):** The histogram shows a relatively stable distribution, with peaks around Instant 20 and Instant 70. The frequency ranges from approximately 18 to 22.
* **Other (Bottom-Right):** The histogram shows a decreasing trend, starting with a frequency around 64 at Instant 0 and decreasing to approximately 54 at Instant 90.
**Right Column (Instant 0-500):**
* **Available (Top-Left):** The histogram shows a fluctuating distribution with multiple peaks and valleys. The frequency ranges from approximately 145 to 165.
* **Charging (Top-Right):** The histogram shows a highly fluctuating distribution with frequent peaks and valleys. The frequency ranges from approximately 10 to 30.
* **Passive (Bottom-Left):** The histogram shows a fluctuating distribution with multiple peaks and valleys. The frequency ranges from approximately 14 to 24.
* **Other (Bottom-Right):** The histogram shows a fluctuating distribution with multiple peaks and valleys. The frequency ranges from approximately 50 to 70.
### Key Observations
* The "Available" state generally has the highest frequency across both time ranges.
* The "Charging" state has the lowest frequency, and its distribution is more volatile than the others.
* The distributions in the right column (Instant 0-500) are more complex and fluctuating than those in the left column (Instant 0-90).
* The "Other" state shows a clear decreasing trend in the left column, but a more fluctuating pattern in the right column.
### Interpretation
The data suggests that the battery is most often in an "Available" state. The "Charging" state is relatively infrequent, indicating that the battery spends most of its time not actively charging. The "Passive" and "Other" states represent periods where the battery is neither fully available nor actively charging, potentially indicating standby or low-power modes.
The difference in distributions between the left and right columns suggests a change in battery usage patterns over time. The longer time range (0-500) exhibits more variability in all states, potentially indicating a more dynamic usage scenario. The decreasing trend in the "Other" state in the left column could indicate a stabilization of the battery's operational mode over the initial 90 instants.
The fluctuating nature of the "Charging" state suggests intermittent charging events, rather than a continuous charging process. The "Other" state's behavior could be related to background processes or system activities that consume battery power without actively charging or providing full availability.