## Chart: Eigenvalue Spectrum
### Overview
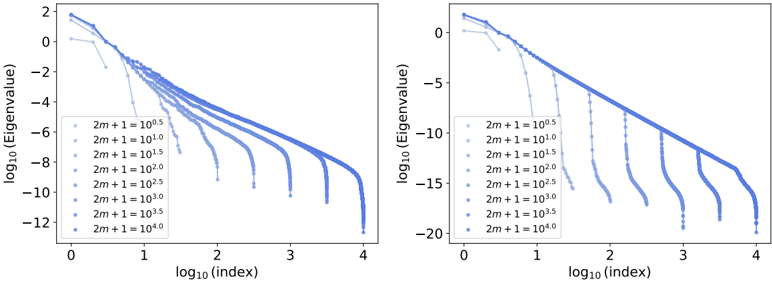
The image presents two charts displaying the eigenvalue spectrum, likely related to a matrix or operator. Both charts share the same axes and general structure, but differ in the range of the y-axis (log10(Eigenvalue)). Each chart plots several curves, each representing a different value of the parameter '2m+1'. The charts visualize how the distribution of eigenvalues changes with varying '2m+1' values.
### Components/Axes
* **X-axis:** log10(Index). Scale ranges from approximately 0 to 4.
* **Y-axis (Left Chart):** log10(Eigenvalue). Scale ranges from approximately 2 to -12.
* **Y-axis (Right Chart):** log10(Eigenvalue). Scale ranges from approximately 2 to -20.
* **Legend (Left Chart):** Located in the top-right corner. Labels are:
* 2m+1 = 10^0.5
* 2m+1 = 10^1.0
* 2m+1 = 10^1.5
* 2m+1 = 10^2.0
* 2m+1 = 10^2.5
* 2m+1 = 10^3.0
* 2m+1 = 10^3.5
* 2m+1 = 10^4.0
* **Legend (Right Chart):** Located in the top-right corner. Labels are:
* 2m+1 = 10^0.5
* 2m+1 = 10^1.0
* 2m+1 = 10^1.5
* 2m+1 = 10^2.0
* 2m+1 = 10^2.5
* 2m+1 = 10^3.0
* 2m+1 = 10^3.5
* 2m+1 = 10^4.0
### Detailed Analysis or Content Details
**Left Chart:**
* **2m+1 = 10^0.5 (Lightest Blue):** The curve starts at approximately log10(Eigenvalue) = 1.8 and decreases monotonically, reaching approximately log10(Eigenvalue) = -11.5 at log10(Index) = 4.
* **2m+1 = 10^1.0:** Starts at approximately log10(Eigenvalue) = 1.7 and decreases to approximately log10(Eigenvalue) = -11.8 at log10(Index) = 4.
* **2m+1 = 10^1.5:** Starts at approximately log10(Eigenvalue) = 1.6 and decreases to approximately log10(Eigenvalue) = -11.9 at log10(Index) = 4.
* **2m+1 = 10^2.0:** Starts at approximately log10(Eigenvalue) = 1.5 and decreases to approximately log10(Eigenvalue) = -12.0 at log10(Index) = 4.
* **2m+1 = 10^2.5:** Starts at approximately log10(Eigenvalue) = 1.4 and decreases to approximately log10(Eigenvalue) = -12.1 at log10(Index) = 4.
* **2m+1 = 10^3.0:** Starts at approximately log10(Eigenvalue) = 1.3 and decreases to approximately log10(Eigenvalue) = -12.2 at log10(Index) = 4.
* **2m+1 = 10^3.5:** Starts at approximately log10(Eigenvalue) = 1.2 and decreases to approximately log10(Eigenvalue) = -12.3 at log10(Index) = 4.
* **2m+1 = 10^4.0 (Darkest Blue):** Starts at approximately log10(Eigenvalue) = 1.1 and decreases to approximately log10(Eigenvalue) = -12.4 at log10(Index) = 4.
**Right Chart:**
* **2m+1 = 10^0.5 (Lightest Blue):** The curve starts at approximately log10(Eigenvalue) = 1.8 and decreases monotonically, reaching approximately log10(Eigenvalue) = -19.5 at log10(Index) = 4.
* **2m+1 = 10^1.0:** Starts at approximately log10(Eigenvalue) = 1.7 and decreases to approximately log10(Eigenvalue) = -19.8 at log10(Index) = 4.
* **2m+1 = 10^1.5:** Starts at approximately log10(Eigenvalue) = 1.6 and decreases to approximately log10(Eigenvalue) = -19.9 at log10(Index) = 4.
* **2m+1 = 10^2.0:** Starts at approximately log10(Eigenvalue) = 1.5 and decreases to approximately log10(Eigenvalue) = -20.0 at log10(Index) = 4.
* **2m+1 = 10^2.5:** Starts at approximately log10(Eigenvalue) = 1.4 and decreases to approximately log10(Eigenvalue) = -20.1 at log10(Index) = 4.
* **2m+1 = 10^3.0:** Starts at approximately log10(Eigenvalue) = 1.3 and decreases to approximately log10(Eigenvalue) = -20.2 at log10(Index) = 4.
* **2m+1 = 10^3.5:** Starts at approximately log10(Eigenvalue) = 1.2 and decreases to approximately log10(Eigenvalue) = -20.3 at log10(Index) = 4.
* **2m+1 = 10^4.0 (Darkest Blue):** Starts at approximately log10(Eigenvalue) = 1.1 and decreases to approximately log10(Eigenvalue) = -20.4 at log10(Index) = 4.
In both charts, all curves exhibit a similar downward trend, indicating a decreasing eigenvalue magnitude as the index increases. The curves are relatively parallel, suggesting that the overall shape of the eigenvalue spectrum remains consistent across different values of '2m+1'.
### Key Observations
* The eigenvalue spectrum consistently decreases as the index increases.
* Increasing the value of '2m+1' shifts the entire spectrum downwards, meaning that the eigenvalues become smaller in magnitude.
* The right chart has a much larger range on the y-axis, allowing for a more detailed view of the lower eigenvalues.
* The curves are closely spaced, indicating a relatively smooth distribution of eigenvalues.
### Interpretation
The charts likely represent the eigenvalue spectrum of a Hamiltonian operator or a related quantum mechanical system. The parameter '2m+1' could be related to the mass or potential strength in the system. The downward trend in the eigenvalue spectrum indicates that the energy levels become more closely spaced as the index increases. The shift in the spectrum with increasing '2m+1' suggests that increasing the mass or potential strength lowers the energy levels.
The difference in the y-axis range between the two charts highlights the importance of choosing an appropriate scale for visualizing data. The right chart provides a more detailed view of the lower eigenvalues, which may be important for understanding the system's behavior at low energies. The parallel nature of the curves suggests that the qualitative features of the eigenvalue spectrum are not significantly affected by changes in '2m+1', but rather the overall energy scale is shifted. This could indicate a robust relationship between the system's parameters and its energy levels.