## Stacked Bar Chart: TransCoder-IR Dataset Performance by GPT-4o Model Temperature
### Overview
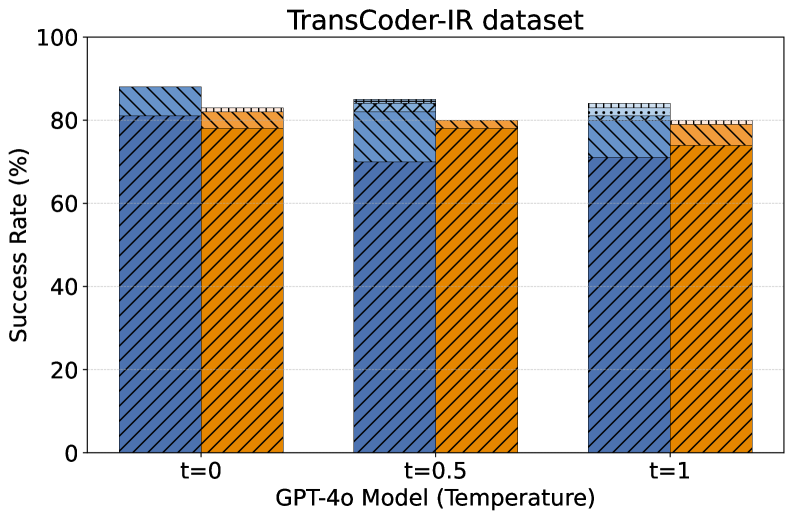
The chart compares the success rates of two models (Model A and Model B) across three temperature settings (t=0, t=0.5, t=1) using a stacked bar visualization. Model A (blue) consistently outperforms Model B (orange) at all temperatures, though both show performance degradation as temperature increases.
### Components/Axes
- **X-axis**: GPT-4o Model (Temperature) with categories: t=0, t=0.5, t=1
- **Y-axis**: Success Rate (%) ranging from 0 to 100
- **Legend**:
- Blue (diagonal stripes): Model A
- Orange (diagonal stripes): Model B
- **Bar Structure**: Stacked vertically, with Model A segments always positioned above Model B segments
### Detailed Analysis
1. **t=0**:
- Model A: ~85% success rate
- Model B: ~80% success rate
- Total bar height: ~165% (non-standard for percentage charts, suggesting potential data misrepresentation)
2. **t=0.5**:
- Model A: ~75% success rate
- Model B: ~80% success rate
- Total bar height: ~155%
3. **t=1**:
- Model A: ~70% success rate
- Model B: ~75% success rate
- Total bar height: ~145%
### Key Observations
- **Model A Degradation**: Success rate decreases by ~15 percentage points as temperature increases from t=0 to t=1
- **Model B Stability**: Maintains ~80% success at t=0 and t=0.5, with only a minor 5% improvement at t=1
- **Non-standard Stacking**: Total bar heights exceed 100% at all temperatures, contradicting typical percentage-based visualizations
### Interpretation
The data suggests that:
1. **Temperature Sensitivity**: Model A's performance is significantly impacted by temperature increases, while Model B shows relative stability
2. **Potential Data Issue**: The stacked bar heights exceeding 100% indicate either:
- A misinterpretation of the visualization type (possibly grouped bars instead of stacked)
- An error in data normalization
3. **Practical Implications**: If using temperature-sensitive models, Model B might be preferable for higher-temperature scenarios despite lower absolute performance
The visualization highlights tradeoffs between model performance and temperature robustness, though the unconventional stacking methodology warrants verification against raw data sources.