## Line Chart: Accuracy vs. Thinking Compute
### Overview
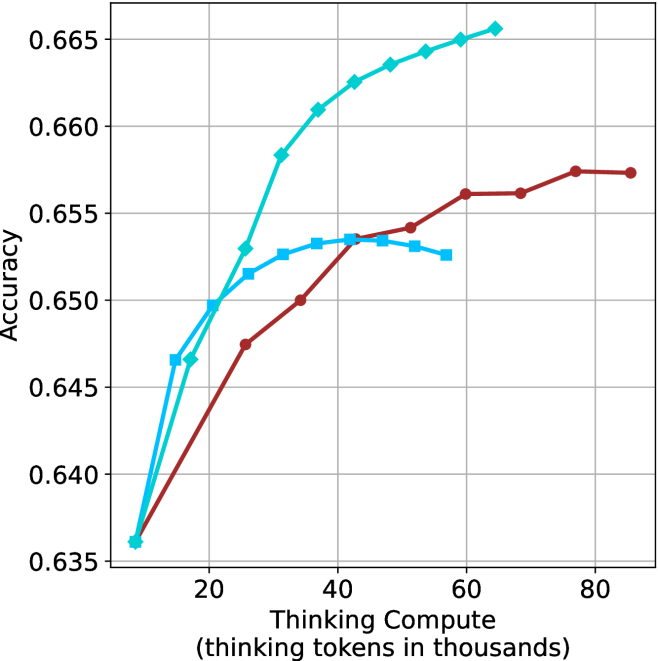
The image displays a line chart comparing the performance of three distinct data series (likely different model configurations or inference strategies) based on their accuracy relative to the amount of "Thinking Compute" utilized. The X-axis represents the compute budget in thousands of tokens, and the Y-axis represents the resulting model accuracy. The chart lacks a legend, so the series are identified by their color and marker shape.
### Components/Axes
* **Y-Axis:** Labeled "Accuracy". The scale ranges from 0.635 to 0.665, with major grid lines at intervals of 0.005.
* **X-Axis:** Labeled "Thinking Compute (thinking tokens in thousands)". The scale ranges from 0 to 80, with major grid lines at intervals of 20.
* **Grid:** A standard Cartesian grid is overlaid on the plot area.
* **Data Series Identification:**
* **Series A (Cyan Diamond):** A cyan-colored line with diamond-shaped markers.
* **Series B (Dark Red Circle):** A dark red-colored line with circular markers.
* **Series C (Medium Blue Square):** A medium blue-colored line with square-shaped markers.
### Detailed Analysis
All three data series originate from a common starting point at approximately (10k tokens, 0.636 accuracy).
**1. Series A (Cyan Diamond)**
* **Trend:** This series exhibits the steepest upward trajectory and achieves the highest overall accuracy. It shows consistent, positive scaling as compute increases.
* **Data Points (Approximate):**
* Starts at ~10k, 0.636.
* Rises sharply to ~0.647 at 17k.
* Continues to rise, reaching ~0.658 at 31k.
* Reaches its peak at the end of the series, approximately 0.666 at 65k tokens.
**2. Series B (Dark Red Circle)**
* **Trend:** This series shows a steady, linear-like increase in accuracy. It is the only series that extends to the highest compute value (85k), though it does not reach the peak accuracy of the Cyan Diamond series.
* **Data Points (Approximate):**
* Starts at ~10k, 0.636.
* Reaches ~0.647 at 25k.
* Reaches ~0.653 at 42k.
* Reaches ~0.656 at 60k.
* Plateaus slightly at the end, reaching ~0.6575 at 85k.
**3. Series C (Medium Blue Square)**
* **Trend:** This series shows an initial increase in accuracy, followed by a peak and a subsequent decline. This suggests a "sweet spot" for compute allocation, after which additional tokens may introduce noise or degrade performance.
* **Data Points (Approximate):**
* Starts at ~10k, 0.636.
* Rises to ~0.649 at 20k.
* Reaches a peak of ~0.6535 at approximately 42k–48k tokens.
* Declines slightly after 48k, dropping to ~0.6525 at 58k tokens.
### Key Observations
* **Common Baseline:** All three configurations perform identically at the lowest compute level (10k tokens).
* **Efficiency Leader:** The Cyan Diamond series is the most efficient, achieving the highest accuracy (0.666) with significantly less compute (65k) than the Dark Red Circle series (which only reaches ~0.657 at 85k).
* **Overthinking Phenomenon:** The Medium Blue Square series demonstrates a clear case of diminishing returns and potential "overthinking." Accuracy improves up to ~45k tokens but degrades slightly as compute increases beyond that point.
### Interpretation
This chart illustrates the relationship between inference-time compute (thinking tokens) and model accuracy. It demonstrates that simply increasing compute does not guarantee better results across all configurations.
* **Strategic Divergence:** The three lines likely represent different model architectures or "thinking" strategies. The Cyan Diamond strategy is clearly superior, as it scales accuracy effectively without hitting a performance ceiling within the observed range.
* **The "Sweet Spot":** The Medium Blue Square series provides a cautionary example of over-allocation. It suggests that for this specific configuration, there is an optimal compute budget (approx. 40k-50k tokens). Beyond this, the model likely begins to hallucinate or over-analyze, leading to a drop in accuracy.
* **Scaling Limits:** The Dark Red Circle series represents a "safe" but less effective scaling strategy. It continues to improve (or at least maintain) accuracy as compute increases, but it lacks the performance ceiling of the Cyan Diamond series, suggesting it may be less optimized for high-compute environments.