## Call Trace: Function Execution Timeline
### Overview
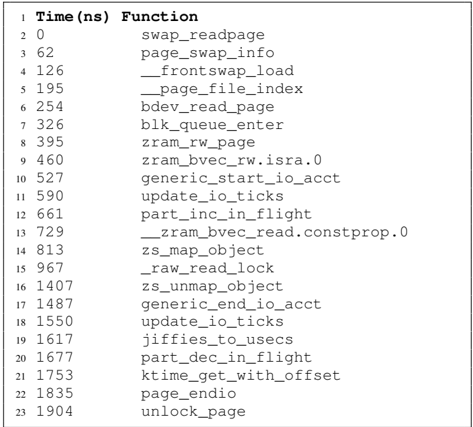
The image presents a call trace, displaying a sequence of function calls along with their execution times in nanoseconds. It provides a timeline of function execution, likely within a software system.
### Components/Axes
* **Column 1:** Line Number (1 to 23)
* **Column 2:** Time (ns) - Execution time in nanoseconds. Ranges from 0 to 1904 ns.
* **Column 3:** Function - Name of the function being called.
### Detailed Analysis
The table shows the execution timeline of various functions. The first column is the line number, the second column is the time in nanoseconds, and the third column is the function name.
Here's a breakdown of the data:
| Line | Time (ns) | Function |
|------|-----------|--------------------------------|
| 1 | | |
| 2 | 0 | swap\_readpage |
| 3 | 62 | page\_swap\_info |
| 4 | 126 | \_frontswap\_load |
| 5 | 195 | \_page\_file\_index |
| 6 | 254 | bdev\_read\_page |
| 7 | 326 | blk\_queue\_enter |
| 8 | 395 | zram\_rw\_page |
| 9 | 460 | zram\_bvec\_rw.isra.0 |
| 10 | 527 | generic\_start\_io\_acct |
| 11 | 590 | update\_io\_ticks |
| 12 | 661 | part\_inc\_in\_flight |
| 13 | 729 | \_zram\_bvec\_read.constprop.0 |
| 14 | 813 | zs\_map\_object |
| 15 | 967 | \_raw\_read\_lock |
| 16 | 1407 | zs\_unmap\_object |
| 17 | 1487 | generic\_end\_io\_acct |
| 18 | 1550 | update\_io\_ticks |
| 19 | 1617 | jiffies\_to\_usecs |
| 20 | 1677 | part\_dec\_in\_flight |
| 21 | 1753 | ktime\_get\_with\_offset |
| 22 | 1835 | page\_endio |
| 23 | 1904 | unlock\_page |
### Key Observations
* The functions are executed sequentially, with increasing time values.
* The time differences between function calls vary, indicating different execution durations.
* Several functions relate to memory management (swap, zram, page).
* I/O accounting functions (generic\_start\_io\_acct, generic\_end\_io\_acct) are present.
### Interpretation
The call trace provides insights into the sequence and timing of function calls within a system. It can be used for performance analysis, debugging, and understanding the flow of execution. The presence of memory management and I/O related functions suggests that the trace might be related to a process involving disk or memory operations. The specific functions called and their timing can help identify bottlenecks or areas for optimization.