## Text List: System Function Trace Log
### Overview
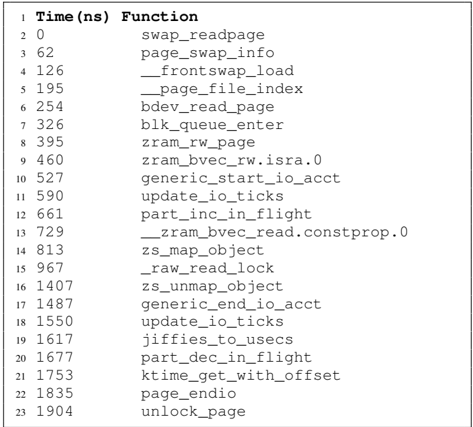
The image displays a structured list of numerical values paired with function names, likely representing a trace log of system-level operations. Each entry includes a line number (1-23), a timestamp (in nanoseconds), and a function name related to memory management or kernel operations.
### Components/Axes
- **Line Numbers**: Sequential integers (1-23) on the left, acting as identifiers.
- **Timestamps**: Numerical values (e.g., 0, 62, 126) in nanoseconds, positioned between line numbers and function names.
- **Function Names**: Technical terms related to memory swapping, page management, and kernel operations (e.g., `swap_readpage`, `zram_rw_page`).
### Detailed Analysis
1. **Line 1**: `0 swap_readpage`
- Timestamp: 0 ns
- Function: `swap_readpage`
2. **Line 2**: `62 page_swap_info`
- Timestamp: 62 ns
- Function: `page_swap_info`
3. **Line 3**: `126 __frontswap_load`
- Timestamp: 126 ns
- Function: `__frontswap_load`
4. **Line 4**: `195 __page_file_index`
- Timestamp: 195 ns
- Function: `__page_file_index`
5. **Line 5**: `254 bdev_read_page`
- Timestamp: 254 ns
- Function: `bdev_read_page`
6. **Line 6**: `326 blk_queue_enter`
- Timestamp: 326 ns
- Function: `blk_queue_enter`
7. **Line 7**: `395 zram_rw_page`
- Timestamp: 395 ns
- Function: `zram_rw_page`
8. **Line 8**: `460 zram_bvec_rw.isra.0`
- Timestamp: 460 ns
- Function: `zram_bvec_rw.isra.0`
9. **Line 9**: `527 generic_start_io_acct`
- Timestamp: 527 ns
- Function: `generic_start_io_acct`
10. **Line 10**: `590 update_io_ticks`
- Timestamp: 590 ns
- Function: `update_io_ticks`
11. **Line 11**: `661 part_inc_in_flight`
- Timestamp: 661 ns
- Function: `part_inc_in_flight`
12. **Line 12**: `729 __zram_bvec_read.constprop.0`
- Timestamp: 729 ns
- Function: `__zram_bvec_read.constprop.0`
13. **Line 13**: `813 zs_map_object`
- Timestamp: 813 ns
- Function: `zs_map_object`
14. **Line 14**: `967 __raw_read_lock`
- Timestamp: 967 ns
- Function: `__raw_read_lock`
15. **Line 15**: `1407 zs_unmap_object`
- Timestamp: 1407 ns
- Function: `zs_unmap_object`
16. **Line 16**: `1487 generic_end_io_acct`
- Timestamp: 1487 ns
- Function: `generic_end_io_acct`
17. **Line 17**: `1550 update_io_ticks`
- Timestamp: 1550 ns
- Function: `update_io_ticks`
18. **Line 18**: `1617 jiffies_to_usecs`
- Timestamp: 1617 ns
- Function: `jiffies_to_usecs`
19. **Line 19**: `1677 part_dec_in_flight`
- Timestamp: 1677 ns
- Function: `part_dec_in_flight`
20. **Line 20**: `1753 ktime_get_with_offset`
- Timestamp: 1753 ns
- Function: `ktime_get_with_offset`
21. **Line 21**: `1835 page_endio`
- Timestamp: 1835 ns
- Function: `page_endio`
22. **Line 22**: `1904 unlock_page`
- Timestamp: 1904 ns
- Function: `unlock_page`
### Key Observations
- **Sequential Execution**: Timestamps increase monotonically (0 ns to 1904 ns), suggesting ordered execution of functions.
- **Memory Management Focus**: Functions like `swap_readpage`, `zram_rw_page`, and `unlock_page` indicate operations tied to memory swapping, compression, or disk I/O.
- **Kernel-Level Activity**: Terms like `__frontswap_load` and `blk_queue_enter` point to low-level kernel interactions.
- **Repetition**: `update_io_ticks` appears twice (lines 10 and 17), possibly marking phase boundaries in I/O accounting.
### Interpretation
This trace log likely originates from a performance profiling tool or kernel debugging session, capturing the sequence of operations during a memory-intensive task. The functions suggest:
1. **Swap Page Handling**: Initial read (`swap_readpage`) and management (`__frontswap_load`, `unlock_page`).
2. **ZRAM Operations**: Compression/decompression via `zram_rw_page` and `__zram_bvec_read`.
3. **I/O Accounting**: `update_io_ticks` and `generic_start_io_acct` track I/O metrics.
4. **Timekeeping**: `ktime_get_with_offset` and `jiffies_to_usecs` convert kernel time units to human-readable formats.
The log provides granular insight into system behavior, useful for diagnosing latency bottlenecks or optimizing memory subsystem performance. The absence of out-of-order timestamps or unexpected function calls suggests a stable, linear execution path.