\n
## Scatter Plot: Confidence vs. Target Length (Astronomy)
### Overview
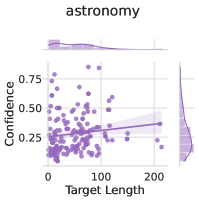
This image presents a scatter plot visualizing the relationship between "Target Length" and "Confidence", specifically within the domain of "astronomy". A regression line is overlaid on the scatter points, along with shaded confidence intervals. Marginal distributions are displayed at the top and right sides of the plot, showing the distribution of "Target Length" and "Confidence" respectively.
### Components/Axes
* **X-axis:** "Target Length" - Scale ranges from approximately 0 to 220.
* **Y-axis:** "Confidence" - Scale ranges from approximately 0.2 to 0.8.
* **Title:** "astronomy" - Located at the top-center of the image.
* **Data Points:** Numerous purple dots representing individual data points.
* **Regression Line:** A dark purple line representing the trend of the data.
* **Confidence Interval:** A light purple shaded area around the regression line, indicating the uncertainty in the estimated trend.
* **Marginal Distribution (Top):** A density plot showing the distribution of "Target Length".
* **Marginal Distribution (Right):** A density plot showing the distribution of "Confidence".
### Detailed Analysis
The scatter plot shows a weak positive correlation between "Target Length" and "Confidence".
* **Regression Line Trend:** The regression line slopes slightly upward, indicating that as "Target Length" increases, "Confidence" tends to increase, but the effect is small.
* **Data Point Distribution:** The data points are clustered around the lower portion of the plot, with a higher density of points at lower "Target Length" values.
* **Marginal Distribution - Target Length:** The distribution of "Target Length" is skewed to the right, with a peak around a value of approximately 20-40 and a tail extending towards higher values.
* **Marginal Distribution - Confidence:** The distribution of "Confidence" appears to be roughly uniform between 0.2 and 0.6, with a slight decrease in density at higher confidence levels.
Let's attempt to extract some approximate data points from the scatter plot:
* At Target Length = 0, Confidence ranges from approximately 0.2 to 0.6, with a concentration around 0.3.
* At Target Length = 50, Confidence ranges from approximately 0.25 to 0.7, with a concentration around 0.35.
* At Target Length = 100, Confidence ranges from approximately 0.25 to 0.6, with a concentration around 0.4.
* At Target Length = 200, Confidence ranges from approximately 0.2 to 0.5, with a concentration around 0.3.
The regression line appears to pass through approximately:
* (0, 0.3)
* (100, 0.35)
* (200, 0.4)
### Key Observations
* The relationship between "Target Length" and "Confidence" is weak. The regression line has a shallow slope.
* The data is quite dispersed, indicating a high degree of variability.
* The marginal distributions reveal that "Target Length" is skewed, while "Confidence" is relatively uniform.
* There are no obvious outliers.
### Interpretation
The data suggests that, within the context of "astronomy", there is a slight tendency for confidence to increase with target length, but this relationship is not strong. The weak correlation could be due to several factors, including the complexity of astronomical data, the limitations of the confidence metric, or the presence of confounding variables. The skewed distribution of "Target Length" suggests that most targets are relatively short, while a smaller number of targets are much longer. The relatively uniform distribution of "Confidence" indicates that confidence levels are fairly consistent across different target lengths. The marginal distributions provide additional context for interpreting the scatter plot, highlighting the underlying distributions of the two variables. The overall plot suggests that "Target Length" is not a particularly strong predictor of "Confidence" in this domain.