## Diagram: Non-uniform vs. Uniform Quantization
### Overview
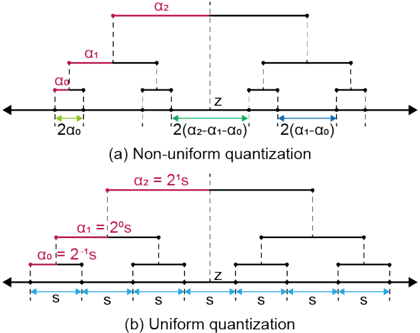
The image compares two quantization methods: **non-uniform** (a) and **uniform** (b). Both diagrams use horizontal lines segmented into intervals, with labels, arrows, and legends to denote relationships between variables.
---
### Components/Axes
#### (a) Non-uniform Quantization
- **Horizontal Line**: Divided into three segments labeled **α₀**, **α₁**, and **α₂** (red, magenta, black, respectively).
- **Arrows**:
- Green arrow between α₀ and α₁: labeled **2α₀**.
- Green arrow between α₁ and α₂: labeled **2(α₂ - α₁ - α₀)**.
- Blue arrow between α₁ and α₂: labeled **2(α₁ - α₀)**.
- **Legend**:
- Red: α₂
- Magenta: α₁
- Black: α₀
- **Text**: "Non-uniform quantization" (top-center).
#### (b) Uniform Quantization
- **Horizontal Line**: Divided into equal segments labeled **S** (blue arrows).
- **Labels**:
- α₀ = 2⁻¹s (0.5s)
- α₁ = 2⁰s (1s)
- α₂ = 2¹s (2s)
- **Legend**:
- Blue: S (step size).
- **Text**: "Uniform quantization" (bottom-center).
---
### Detailed Analysis
#### (a) Non-uniform Quantization
- **Segment Lengths**:
- α₀ to α₁: **2α₀** (green arrow).
- α₁ to α₂: **2(α₂ - α₁ - α₀)** (green arrow) and **2(α₁ - α₀)** (blue arrow).
- **Key Relationships**:
- The interval between α₁ and α₂ is split into two sub-intervals: one dependent on the difference between α₂ and the sum of α₁ and α₀, and another dependent on the difference between α₁ and α₀.
#### (b) Uniform Quantization
- **Segment Lengths**:
- All intervals are labeled **S** (blue arrows), with α₀ = 0.5s, α₁ = 1s, α₂ = 2s.
- **Key Relationships**:
- Each segment represents a fixed step size (S), with α values doubling sequentially (powers of 2).
---
### Key Observations
1. **Non-uniform Quantization**:
- Intervals vary based on α values (e.g., 2α₀, 2(α₂ - α₁ - α₀)).
- Arrows use distinct colors (green/blue) for sub-intervals, but these are not in the legend.
2. **Uniform Quantization**:
- Equal step sizes (S) across all intervals.
- α values follow a geometric progression (powers of 2).
---
### Interpretation
- **Non-uniform Quantization**:
- Suggests adaptive interval sizing, where differences between α values determine segment lengths. This could optimize precision in ranges with higher variability.
- The use of multiple arrow colors (green/blue) implies hierarchical or conditional relationships between intervals.
- **Uniform Quantization**:
- Fixed step sizes (S) simplify implementation but lack flexibility. The doubling of α values (0.5s, 1s, 2s) indicates a binary or exponential scaling pattern.
- **Comparison**:
- Non-uniform allows dynamic adjustment, while uniform prioritizes simplicity. The diagrams highlight trade-offs between precision and computational efficiency.
---
**Note**: No numerical values are explicitly provided for α₀, α₁, or α₂ in (a), but their relationships are defined via algebraic expressions. The uniform quantization explicitly defines α values as powers of 2.