## Charts: Data Size Bottleneck & Overfitting
### Overview
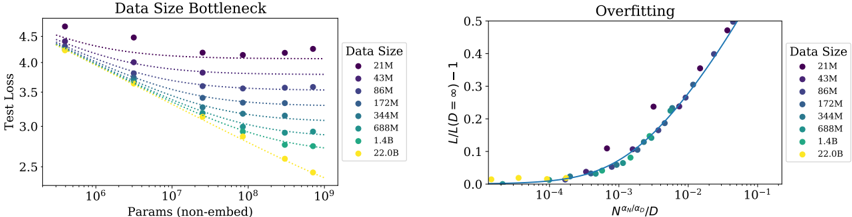
The image presents two charts side-by-side. The left chart, titled "Data Size Bottleneck", depicts the relationship between the number of parameters (non-embedding) and test loss for various data sizes. The right chart, titled "Overfitting", shows the relationship between L/(L-1) and N<sub>val</sub>/D<sub>0</sub>, also for different data sizes. Both charts aim to illustrate how data size impacts model performance, specifically concerning the bottleneck effect and overfitting.
### Components/Axes
**Left Chart (Data Size Bottleneck):**
* **X-axis:** Params (non-embed) - Logarithmic scale, ranging from approximately 10<sup>6</sup> to 10<sup>9</sup>.
* **Y-axis:** Test Loss - Linear scale, ranging from approximately 2.4 to 4.6.
* **Legend:** Data Size, with the following categories:
* 21M (Purple)
* 43M (Dark Blue)
* 86M (Light Blue)
* 172M (Teal)
* 344M (Green)
* 688M (Dark Green)
* 1.4B (Yellow)
* 22.08 (Gold)
**Right Chart (Overfitting):**
* **X-axis:** N<sub>val</sub>/D<sub>0</sub> - Logarithmic scale, ranging from approximately 10<sup>-5</sup> to 10<sup>-1</sup>.
* **Y-axis:** L/(L-1) - 1 - Linear scale, ranging from approximately 0 to 0.5.
* **Legend:** Data Size, with the same categories as the left chart:
* 21M (Purple)
* 43M (Dark Blue)
* 86M (Light Blue)
* 172M (Teal)
* 344M (Green)
* 688M (Dark Green)
* 1.4B (Yellow)
* 22.08 (Gold)
### Detailed Analysis or Content Details
**Left Chart (Data Size Bottleneck):**
* **21M (Purple):** The line starts at approximately 4.5 and decreases slowly, leveling off around 3.8.
* **43M (Dark Blue):** The line starts at approximately 4.3 and decreases more rapidly than the 21M line, reaching around 3.2.
* **86M (Light Blue):** The line starts at approximately 4.1 and decreases rapidly, reaching around 2.8.
* **172M (Teal):** The line starts at approximately 3.9 and decreases rapidly, reaching around 2.7.
* **344M (Green):** The line starts at approximately 3.6 and decreases rapidly, reaching around 2.6.
* **688M (Dark Green):** The line starts at approximately 3.3 and decreases rapidly, reaching around 2.5.
* **1.4B (Yellow):** The line starts at approximately 3.1 and decreases rapidly, reaching around 2.4.
* **22.08 (Gold):** The line starts at approximately 2.9 and decreases very rapidly, reaching around 2.3.
**Right Chart (Overfitting):**
* **21M (Purple):** The line starts at approximately 0 and increases rapidly, reaching 0.45 at approximately 10<sup>-2</sup>.
* **43M (Dark Blue):** The line starts at approximately 0 and increases rapidly, reaching 0.35 at approximately 10<sup>-2</sup>.
* **86M (Light Blue):** The line starts at approximately 0 and increases rapidly, reaching 0.25 at approximately 10<sup>-2</sup>.
* **172M (Teal):** The line starts at approximately 0 and increases rapidly, reaching 0.18 at approximately 10<sup>-2</sup>.
* **344M (Green):** The line starts at approximately 0 and increases rapidly, reaching 0.12 at approximately 10<sup>-2</sup>.
* **688M (Dark Green):** The line starts at approximately 0 and increases rapidly, reaching 0.08 at approximately 10<sup>-2</sup>.
* **1.4B (Yellow):** The line starts at approximately 0 and increases rapidly, reaching 0.05 at approximately 10<sup>-2</sup>.
* **22.08 (Gold):** The line starts at approximately 0 and increases rapidly, reaching 0.03 at approximately 10<sup>-2</sup>.
### Key Observations
* In the "Data Size Bottleneck" chart, increasing the data size consistently lowers the test loss, indicating improved model performance. The rate of decrease slows down as the data size increases, suggesting a diminishing return.
* In the "Overfitting" chart, larger data sizes (smaller values on the x-axis) result in lower values of L/(L-1) - 1, indicating less overfitting. The curves show a steep increase for smaller data sizes, demonstrating a higher susceptibility to overfitting.
* The lines for larger data sizes (yellow and gold) are more flattened in both charts, suggesting that they are less sensitive to changes in parameters and less prone to overfitting.
### Interpretation
These charts demonstrate the crucial role of data size in training machine learning models. The "Data Size Bottleneck" chart illustrates that increasing data size reduces test loss, but there's a point of diminishing returns. The "Overfitting" chart shows that larger datasets mitigate overfitting, as evidenced by the lower L/(L-1) - 1 values.
The relationship between the two charts is that the bottleneck effect (limited improvement with more parameters) is exacerbated by overfitting when the data size is small. As the data size increases, the model can leverage more parameters without overfitting, leading to better performance.
The gold line (22.08) consistently performs best across both charts, indicating that this data size provides a good balance between model capacity and generalization ability. The purple line (21M) consistently performs worst, highlighting the challenges of training models with limited data. The logarithmic scales on the x-axes suggest that the relationships are not linear, and that the benefits of increasing data size or parameters may saturate at some point.