# Technical Document Extraction: Vector Space Optimization Diagram
## 1. Image Overview
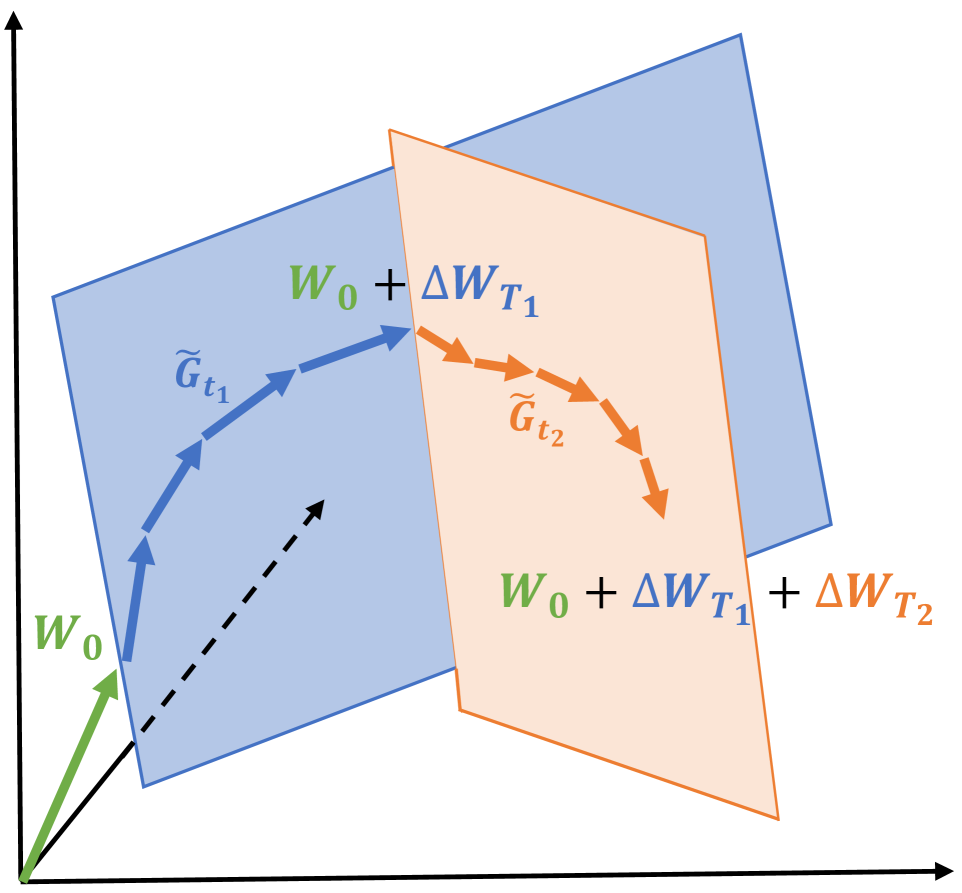
This image is a technical mathematical diagram illustrating a sequential optimization process or weight update trajectory within a high-dimensional space. It utilizes vectors, planes, and directed paths to represent the evolution of a state (likely neural network weights) across two distinct tasks or time intervals.
## 2. Coordinate System and Spatial Grounding
* **Axes:** The diagram is set against a 3D coordinate system represented by three black arrows originating from a common origin $[0, 0]$ at the bottom left.
* **Vertical Axis:** Points upward.
* **Horizontal Axis:** Points to the right.
* **Depth Axis:** Points diagonally upward and to the right.
* **Planes:** Two intersecting tilted planes represent distinct subspaces or manifolds.
* **Blue Plane (Background/Left):** Represents the subspace associated with the first task ($T_1$).
* **Orange Plane (Foreground/Right):** Represents the subspace associated with the second task ($T_2$). It intersects the blue plane along a vertical-diagonal line.
## 3. Component Analysis and Mathematical Notation
### A. Initial State
* **Vector $W_0$:** A solid green arrow originating from the origin and pointing to the bottom-left corner of the blue plane.
* **Label:** $W_0$ (Green text).
### B. First Phase (Task $T_1$)
* **Trajectory:** A series of four blue dashed arrows forming a curved path upward and to the right across the surface of the blue plane.
* **Gradient Label:** $\tilde{G}_{t_1}$ (Blue text with a tilde) is positioned above the first half of this trajectory, indicating the stochastic gradient or update direction for task 1.
* **Endpoint:** The path terminates at the intersection of the blue and orange planes.
* **State Label:** $W_0 + \Delta W_{T_1}$
* $W_0$ is in green.
* $+ \Delta W_{T_1}$ is in blue.
* This represents the accumulated weights after the first optimization phase.
### C. Second Phase (Task $T_2$)
* **Trajectory:** A series of four orange dashed arrows forming a curved path downward and to the right across the surface of the orange plane.
* **Gradient Label:** $\tilde{G}_{t_2}$ (Orange text with a tilde) is positioned below the start of this trajectory, indicating the update direction for task 2.
* **Endpoint:** The path terminates at the bottom-right section of the orange plane.
* **Final State Label:** $W_0 + \Delta W_{T_1} + \Delta W_{T_2}$
* $W_0$ is in green.
* $+ \Delta W_{T_1}$ is in blue.
* $+ \Delta W_{T_2}$ is in orange.
* This represents the final weight state after both optimization phases.
### D. Auxiliary Elements
* **Black Dashed Arrow:** Originates from the origin and points toward the center of the blue plane. This likely represents a projection or a reference vector (such as a meta-learning initialization or a direct path) that is not part of the sequential update trajectory.
## 4. Process Flow and Logic
1. **Initialization:** The process starts at the origin with initial weights $W_0$.
2. **Task 1 Optimization:** The system follows the gradient $\tilde{G}_{t_1}$ within the blue subspace. The total displacement in this phase is $\Delta W_{T_1}$.
3. **Intermediate State:** The weights reach the intersection point $W_0 + \Delta W_{T_1}$.
4. **Task 2 Optimization:** From the intersection, the system follows the gradient $\tilde{G}_{t_2}$ within the orange subspace. The additional displacement is $\Delta W_{T_2}$.
5. **Final State:** The resulting weights are the sum of the initial state and the displacements from both tasks.
## 5. Text Extraction Summary
| Label | Color | Meaning |
| :--- | :--- | :--- |
| $W_0$ | Green | Initial weight vector/state. |
| $\tilde{G}_{t_1}$ | Blue | Stochastic gradient/update for Task 1. |
| $W_0 + \Delta W_{T_1}$ | Green/Blue | Weight state after Task 1. |
| $\tilde{G}_{t_2}$ | Orange | Stochastic gradient/update for Task 2. |
| $W_0 + \Delta W_{T_1} + \Delta W_{T_2}$ | Green/Blue/Orange | Final weight state after Task 1 and Task 2. |