\n
## Bar Chart: Accuracy vs. Triple Overlap
### Overview
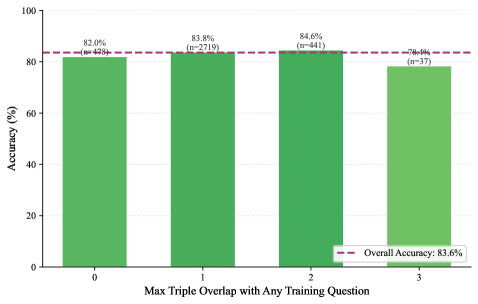
This image presents a bar chart illustrating the relationship between "Max Triple Overlap with Any Training Question" and "Accuracy (%)". The chart displays accuracy values for four different levels of triple overlap, along with the sample size (n) for each level. A horizontal dashed line indicates the overall accuracy.
### Components/Axes
* **X-axis:** "Max Triple Overlap with Any Training Question". Categories are 0, 1, 2, and 3.
* **Y-axis:** "Accuracy (%)". Scale ranges from 0 to 100.
* **Bars:** Represent accuracy for each overlap level. The bars are green.
* **Horizontal Dashed Line:** Represents "Overall Accuracy: 83.6%". The line is magenta.
* **Labels:** Each bar is labeled with its corresponding accuracy percentage and sample size (n).
### Detailed Analysis
The chart shows four bars, one for each value of "Max Triple Overlap with Any Training Question".
* **Overlap 0:** The bar reaches approximately 82.0% accuracy (n=426).
* **Overlap 1:** The bar reaches approximately 83.8% accuracy (n=279).
* **Overlap 2:** The bar reaches approximately 84.6% accuracy (n=41).
* **Overlap 3:** The bar reaches approximately 78.4% accuracy (n=37).
The overall accuracy is indicated by a horizontal dashed magenta line at approximately 83.6%.
The trend shows an initial increase in accuracy as the triple overlap increases from 0 to 2, followed by a decrease at an overlap of 3.
### Key Observations
* The highest accuracy is achieved at an overlap of 2 (84.6%).
* The lowest accuracy is observed at an overlap of 3 (78.4%).
* The sample size varies significantly across the overlap levels, with the largest sample size at overlap 0 (n=426) and the smallest at overlap 3 (n=37).
* The overall accuracy (83.6%) falls between the accuracy values for overlap 1 and overlap 2.
### Interpretation
The data suggests that a moderate level of triple overlap with training questions (specifically, an overlap of 2) is associated with the highest accuracy. However, increasing the overlap further to 3 results in a noticeable decrease in accuracy. This could indicate that excessive overlap introduces noise or redundancy, hindering the model's ability to generalize.
The varying sample sizes are a crucial consideration. The accuracy value for overlap 2 is based on a relatively small sample size (n=41), which may make it less reliable than the values for overlap 0 and 1, which have larger sample sizes. The drop in accuracy at overlap 3 could be due to the small sample size, or it could be a genuine effect.
The overall accuracy provides a baseline for comparison. The fact that the accuracy at overlap 3 falls below the overall accuracy suggests that this level of overlap may be detrimental to performance. Further investigation with larger sample sizes at overlap 3 would be needed to confirm this. The chart demonstrates a non-linear relationship between triple overlap and accuracy, suggesting that there is an optimal level of overlap for maximizing performance.