## Scatter Plot: CausalCite Comparison by Methodology
### Overview
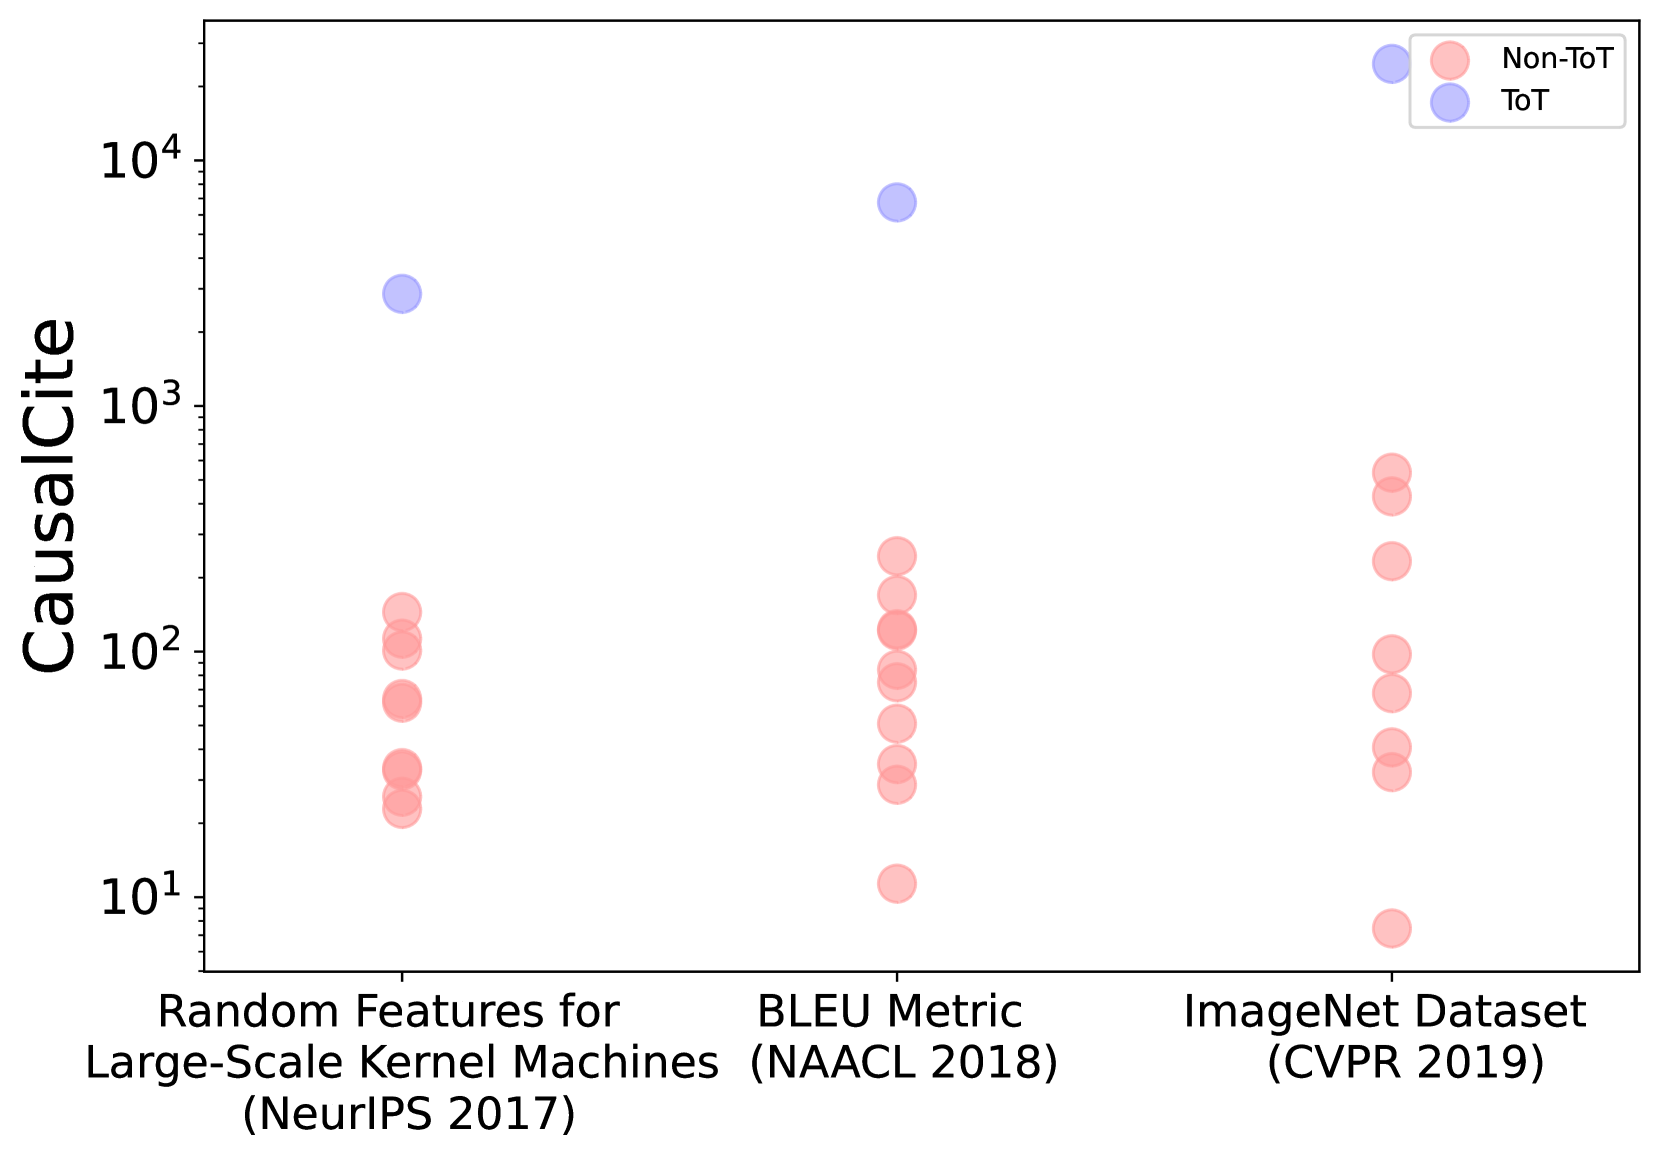
The image is a scatter plot visualizing "CausalCite" values across three distinct academic categories. The chart compares two methodologies: "ToT" (Tree of Thoughts) and "Non-ToT" (Non-Tree of Thoughts). The Y-axis uses a logarithmic scale, indicating that the differences between data points represent orders of magnitude.
### Components/Axes
* **Y-Axis:** Labeled "CausalCite". The scale is logarithmic, with major ticks at $10^1$, $10^2$, $10^3$, and $10^4$.
* **X-Axis:** Contains three categorical labels representing specific research papers/datasets:
1. "Random Features for Large-Scale Kernel Machines (NeurIPS 2017)"
2. "BLEU Metric (NAACL 2018)"
3. "ImageNet Dataset (CVPR 2019)"
* **Legend (Top-Right):**
* **Red Circle:** "Non-ToT"
* **Blue Circle:** "ToT"
### Detailed Analysis
The data is segmented into three vertical regions corresponding to the X-axis categories.
**1. Random Features for Large-Scale Kernel Machines (NeurIPS 2017)**
* **ToT (Blue):** A single data point is positioned at approximately $3 \times 10^3$.
* **Non-ToT (Red):** A cluster of approximately 6 data points is visible, ranging from roughly $2 \times 10^1$ to $1.5 \times 10^2$.
**2. BLEU Metric (NAACL 2018)**
* **ToT (Blue):** A single data point is positioned at approximately $7 \times 10^3$.
* **Non-ToT (Red):** A cluster of approximately 7 data points is visible, ranging from roughly $1 \times 10^1$ to $2.5 \times 10^2$.
**3. ImageNet Dataset (CVPR 2019)**
* **ToT (Blue):** A single data point is positioned at approximately $3 \times 10^4$.
* **Non-ToT (Red):** A cluster of approximately 6 data points is visible, ranging from roughly $8 \times 10^0$ to $5 \times 10^2$.
### Key Observations
* **Consistent Outperformance:** In every category, the "ToT" (Blue) data point is significantly higher than the entire cluster of "Non-ToT" (Red) data points.
* **Logarithmic Gap:** The gap between the ToT and Non-ToT groups is consistently at least one order of magnitude (10x) and often approaches two orders of magnitude (100x).
* **Upward Trend:** The "ToT" data points show an upward trend from left to right, increasing from $\approx 3,000$ to $\approx 30,000$ across the three categories.
* **Non-ToT Stability:** The "Non-ToT" clusters remain relatively stable in their distribution, consistently staying below the $10^3$ threshold, though the upper bound of the cluster increases slightly in the third category.
### Interpretation
* **Methodological Impact:** The data strongly suggests that the "ToT" (Tree of Thoughts) methodology is associated with significantly higher "CausalCite" values compared to the "Non-ToT" baseline methods.
* **Metric Significance:** Assuming "CausalCite" is a metric for citation impact or influence, this chart serves as evidence that the ToT approach yields research or results that are cited far more frequently than the baseline methods in these specific fields.
* **Scaling:** The fact that the ToT value increases as the categories progress (from NeurIPS 2017 to CVPR 2019) might suggest that the ToT methodology scales well or is applied to increasingly impactful research areas over time.
* **Outliers:** There are no "ToT" outliers; the single data point per category is consistently the maximum value in its respective column, reinforcing the superiority of the ToT method within this dataset.