## Line Chart: EGA vs. Environment Step for Different Goal Counts
### Overview
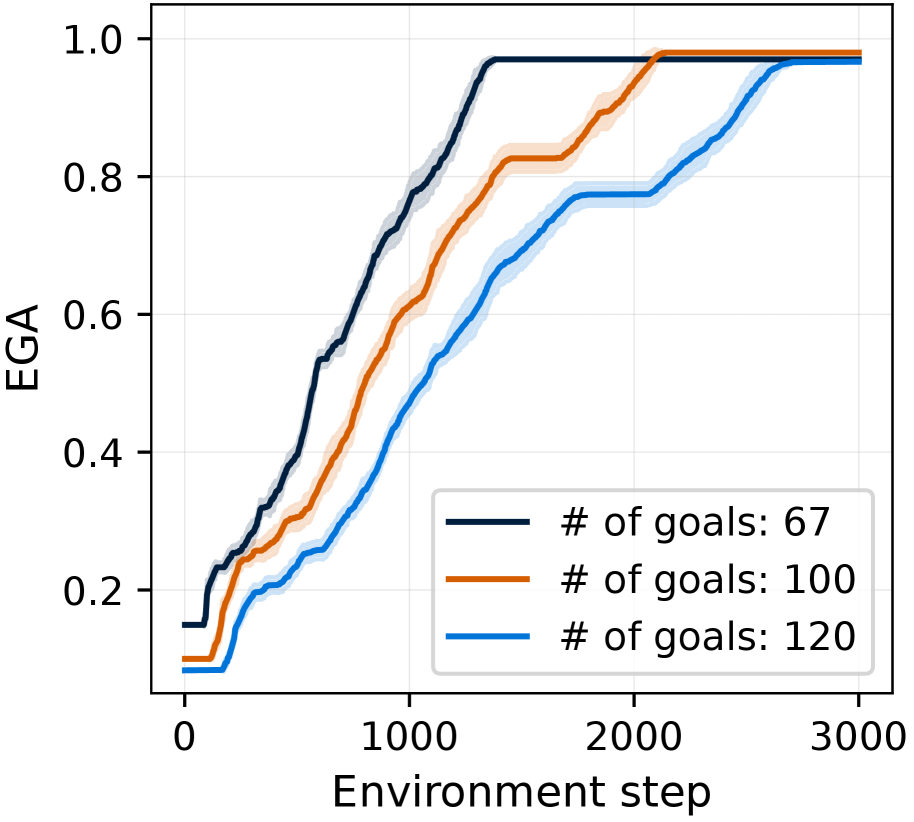
The image displays a line chart plotting the performance metric "EGA" against "Environment step" for three different experimental conditions, each defined by a specific number of goals. The chart illustrates the learning or convergence curves for these conditions, showing how performance improves over time (steps). All three curves exhibit a sigmoidal (S-shaped) growth pattern, starting low, increasing rapidly, and then plateauing near the maximum value of 1.0.
### Components/Axes
* **Chart Type:** Line chart with shaded confidence bands or variance regions.
* **X-Axis:**
* **Label:** "Environment step"
* **Scale:** Linear, ranging from 0 to 3000.
* **Major Ticks:** 0, 1000, 2000, 3000.
* **Y-Axis:**
* **Label:** "EGA"
* **Scale:** Linear, ranging from 0.0 to 1.0.
* **Major Ticks:** 0.0, 0.2, 0.4, 0.6, 0.8, 1.0.
* **Legend:**
* **Position:** Bottom-right corner of the plot area.
* **Entries:**
1. **Dark Blue Line:** "# of goals: 67"
2. **Orange Line:** "# of goals: 100"
3. **Light Blue Line:** "# of goals: 120"
* **Data Series:** Three distinct lines, each with a corresponding semi-transparent shaded area of the same color, likely representing standard deviation or confidence intervals.
### Detailed Analysis
**Trend Verification & Data Point Extraction:**
1. **Dark Blue Line (# of goals: 67):**
* **Trend:** This line shows the fastest initial growth. It starts at approximately EGA = 0.15 at step 0, rises steeply, and begins to plateau around step 1500. It reaches a near-maximum value (≈0.98) first.
* **Approximate Data Points:**
* Step 0: EGA ≈ 0.15
* Step 500: EGA ≈ 0.55
* Step 1000: EGA ≈ 0.80
* Step 1500: EGA ≈ 0.97 (plateau begins)
* Step 3000: EGA ≈ 0.98
2. **Orange Line (# of goals: 100):**
* **Trend:** This line has an intermediate growth rate. It starts lower than the dark blue line, at approximately EGA = 0.10 at step 0. Its steepest ascent occurs between steps 500 and 1500. It plateaus later than the dark blue line, around step 2000.
* **Approximate Data Points:**
* Step 0: EGA ≈ 0.10
* Step 500: EGA ≈ 0.30
* Step 1000: EGA ≈ 0.65
* Step 1500: EGA ≈ 0.85
* Step 2000: EGA ≈ 0.97 (plateau begins)
* Step 3000: EGA ≈ 0.98
3. **Light Blue Line (# of goals: 120):**
* **Trend:** This line shows the slowest growth. It starts at the lowest point, approximately EGA = 0.05 at step 0. Its growth is more gradual, with the steepest section between steps 1000 and 2000. It is the last to plateau, reaching its maximum around step 2500.
* **Approximate Data Points:**
* Step 0: EGA ≈ 0.05
* Step 500: EGA ≈ 0.20
* Step 1000: EGA ≈ 0.45
* Step 1500: EGA ≈ 0.70
* Step 2000: EGA ≈ 0.85
* Step 2500: EGA ≈ 0.97 (plateau begins)
* Step 3000: EGA ≈ 0.98
### Key Observations
1. **Inverse Relationship:** There is a clear inverse relationship between the number of goals and the rate of learning (convergence speed). The condition with the fewest goals (67) learns the fastest, while the condition with the most goals (120) learns the slowest.
2. **Common Asymptote:** Despite different learning speeds, all three conditions appear to converge to approximately the same final performance level (EGA ≈ 0.98) by the end of the plotted environment steps (3000).
3. **Performance Gap:** The performance gap between the conditions is most pronounced during the middle phase of learning (between steps 500 and 2000). For example, at step 1000, the EGA for 67 goals is ~0.80, while for 120 goals it is only ~0.45.
4. **Variance:** The shaded bands suggest that variance or uncertainty in the EGA measurement is relatively consistent across the learning phase for each condition and narrows slightly as performance plateaus.
### Interpretation
The data demonstrates a fundamental trade-off in the system being measured: **task complexity (represented by the number of goals) negatively impacts learning efficiency.** While the system is capable of achieving high performance (near-perfect EGA) regardless of the goal count within the tested range, the "cost" is measured in environment steps. More complex tasks (more goals) require significantly more interaction with the environment to reach the same level of mastery.
This has practical implications for training or optimization processes. If environment steps correspond to real-world time, computational cost, or data collection effort, then reducing the number of concurrent or sequential goals could lead to much faster training times without sacrificing final performance. The plateau indicates a saturation point where additional steps yield negligible improvement, suggesting that for this specific metric and setup, 3000 steps are sufficient for convergence even in the most complex condition shown. The consistent final value implies that the ultimate capability of the system is not limited by the number of goals, but the path to reach that capability is.