## Histograms: Adult Census Income Fairness Evaluation
### Overview
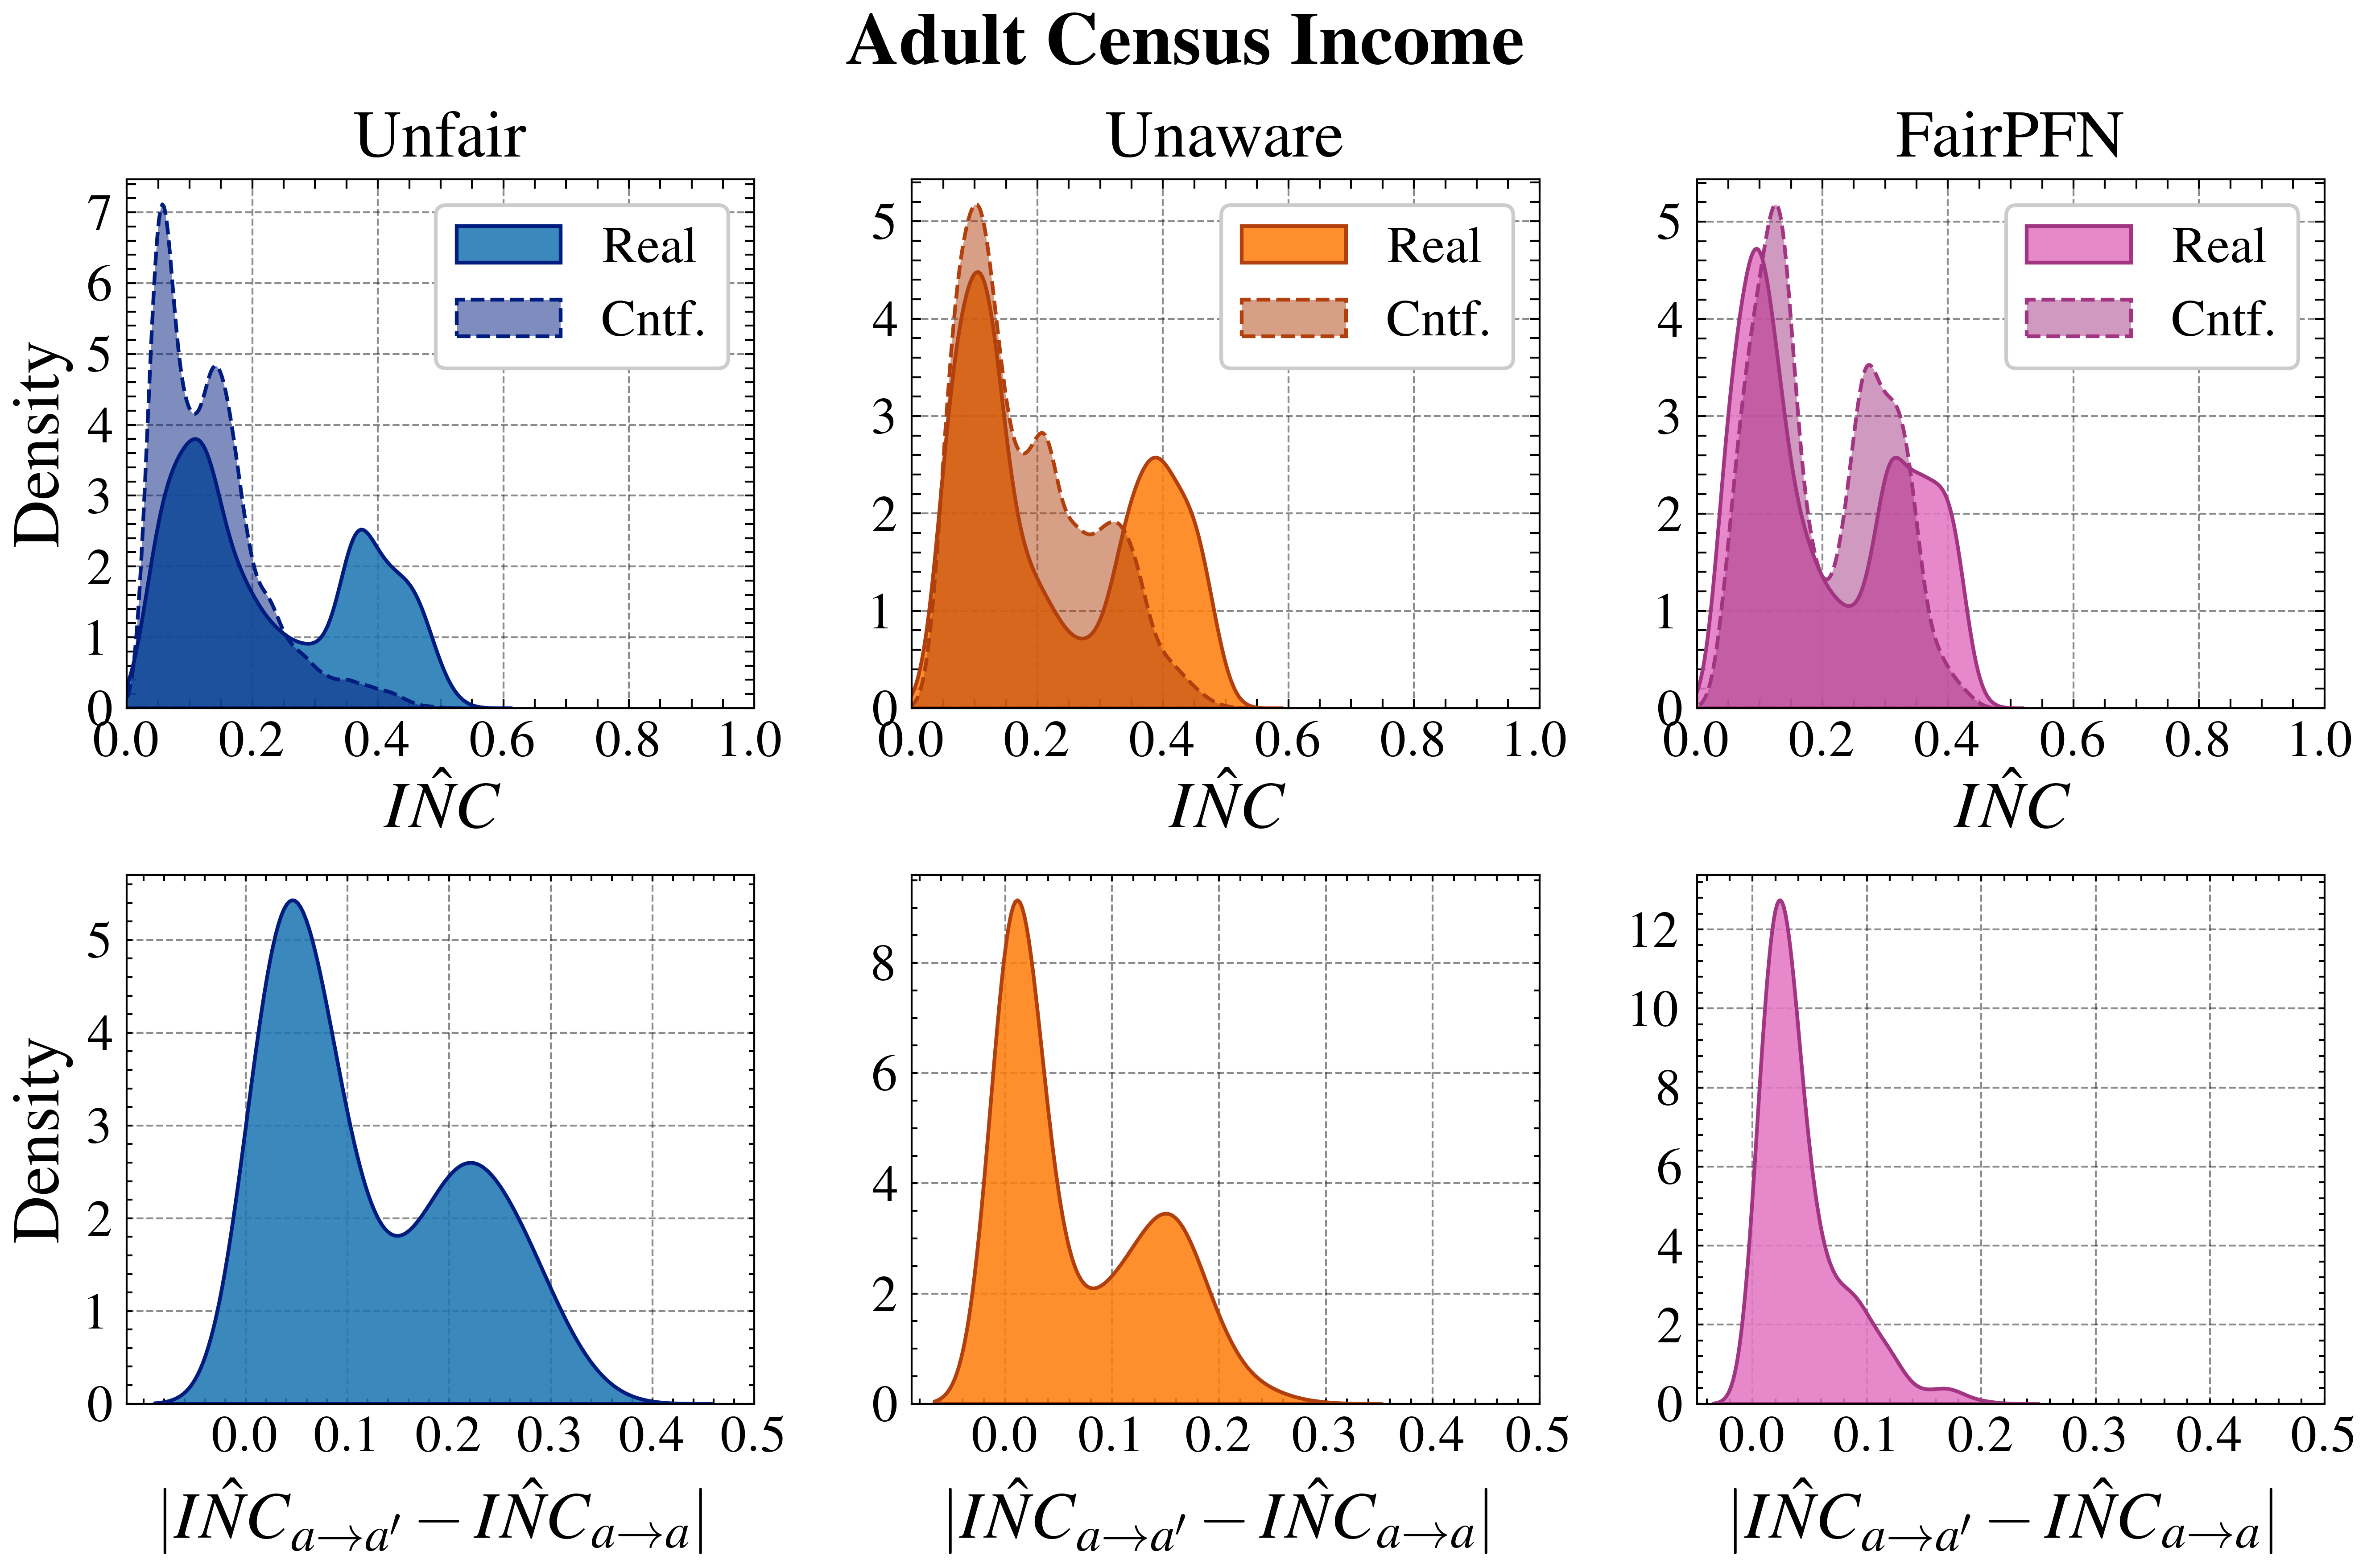
The image presents six histograms arranged in a 2x3 grid, evaluating the fairness of different models ("Unfair", "Unaware", "FairPFN") in predicting adult census income. Each model is assessed using two metrics: ÎNC (likely representing an income prediction confidence score) and the absolute difference between ÎNC values under different conditions (ÎNC<sub>α→α'</sub> - ÎNC<sub>α→α</sub>). Each histogram displays the density distribution of these metrics for both "Real" data and a "Cntf." (likely counterfactual) dataset.
### Components/Axes
* **Title:** "Adult Census Income" - positioned at the top-center of the image.
* **Subtitles:** "Unfair", "Unaware", "FairPFN" - positioned above each column of histograms.
* **X-axis Label (Top Row):** "ÎNC" - appears under each histogram in the top row. Scale ranges from 0.0 to 1.0.
* **X-axis Label (Bottom Row):** "|ÎNC<sub>α→α'</sub> - ÎNC<sub>α→α</sub>|" - appears under each histogram in the bottom row. Scale ranges from 0.0 to 0.5.
* **Y-axis Label (All Histograms):** "Density" - appears on the left side of each histogram. Scale ranges from 0.0 to approximately 6.0 (varying slightly between histograms).
* **Legend (All Histograms):**
* "Real" - represented by a solid fill color (blue for "Unfair", orange for "Unaware", purple for "FairPFN").
* "Cntf." - represented by a dashed fill color (light blue for "Unfair", light orange for "Unaware", light purple for "FairPFN").
* **Gridlines:** Present on all histograms, aiding in value estimation.
### Detailed Analysis or Content Details
**Column 1: "Unfair"**
* **Top Histogram (ÎNC):** The "Real" data (blue) shows a bimodal distribution with peaks around ÎNC = 0.25 and ÎNC = 0.65. The "Cntf." data (light blue, dashed) shows a similar bimodal distribution, but with lower density overall and peaks around ÎNC = 0.3 and ÎNC = 0.7.
* **Bottom Histogram (|ÎNC<sub>α→α'</sub> - ÎNC<sub>α→α</sub>|):** The "Real" data (blue) is heavily skewed to the left, with a peak around 0.05 and a long tail extending to 0.4. The "Cntf." data (light blue, dashed) is also skewed to the left, with a peak around 0.03 and a tail extending to 0.3.
**Column 2: "Unaware"**
* **Top Histogram (ÎNC):** The "Real" data (orange) shows a unimodal distribution with a peak around ÎNC = 0.55. The "Cntf." data (light orange, dashed) shows a similar unimodal distribution, but with a broader peak around ÎNC = 0.5.
* **Bottom Histogram (|ÎNC<sub>α→α'</sub> - ÎNC<sub>α→α</sub>|):** The "Real" data (orange) is centered around 0.1, with a peak around 0.08 and a tail extending to 0.4. The "Cntf." data (light orange, dashed) is also centered around 0.1, with a peak around 0.07 and a tail extending to 0.3.
**Column 3: "FairPFN"**
* **Top Histogram (ÎNC):** The "Real" data (purple) shows a bimodal distribution with peaks around ÎNC = 0.3 and ÎNC = 0.7. The "Cntf." data (light purple, dashed) shows a similar bimodal distribution, but with a broader peak around ÎNC = 0.3 and ÎNC = 0.7.
* **Bottom Histogram (|ÎNC<sub>α→α'</sub> - ÎNC<sub>α→α</sub>|):** The "Real" data (purple) is centered around 0.15, with a peak around 0.1 and a tail extending to 0.5. The "Cntf." data (light purple, dashed) is also centered around 0.15, with a peak around 0.08 and a tail extending to 0.4.
### Key Observations
* The "Unfair" model exhibits the most pronounced bimodal distribution in ÎNC, suggesting significant disparities in confidence scores.
* The "Unaware" model shows the most concentrated distribution in ÎNC, indicating more consistent confidence scores.
* The "FairPFN" model also exhibits a bimodal distribution in ÎNC, but with a wider spread than the "Unfair" model.
* The absolute difference metric (|ÎNC<sub>α→α'</sub> - ÎNC<sub>α→α</sub>|) is generally lower for the "Unaware" model compared to the "Unfair" and "FairPFN" models, suggesting less sensitivity to changes in input conditions.
* The "Cntf." data consistently shows lower density than the "Real" data across all models and metrics.
### Interpretation
These histograms are evaluating the fairness of different income prediction models. The ÎNC metric likely represents a confidence score assigned by the model to its income prediction. The absolute difference metric quantifies the change in confidence score when a sensitive attribute is altered (represented by α and α').
The "Unfair" model's bimodal distribution in ÎNC suggests that the model assigns significantly different confidence scores to different groups, potentially indicating bias. The "Unaware" model, designed to be oblivious to sensitive attributes, exhibits a more uniform distribution, suggesting less bias. The "FairPFN" model attempts to mitigate bias through a fairness-aware algorithm, and its distribution falls between the "Unfair" and "Unaware" models.
The lower absolute difference metric for the "Unaware" model indicates that its predictions are less sensitive to changes in sensitive attributes, which is a desirable property for a fair model. The consistently lower density of the "Cntf." data suggests that the counterfactual data represents less common or more extreme scenarios.
The image demonstrates a trade-off between accuracy and fairness. While the "Unaware" model may be fairer, it might sacrifice some predictive accuracy compared to the "Unfair" model. The "FairPFN" model attempts to balance these two objectives.