\n
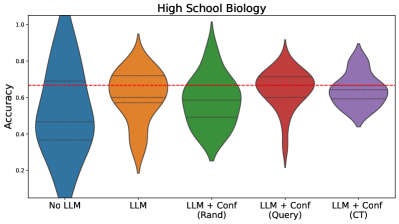
## Violin Plot: High School Biology Accuracy
### Overview
This image presents a violin plot comparing the accuracy of different approaches to answering high school biology questions. The approaches are: "No LLM", "LLM", "LLM + Conf (Rand)", "LLM + Conf (Query)", and "LLM + Conf (CT)". The y-axis represents accuracy, ranging from approximately 0.2 to 1.0. A horizontal dashed red line is present across the plot, likely representing a baseline or threshold accuracy.
### Components/Axes
* **Title:** "High School Biology"
* **X-axis:** Categorical, representing the different approaches:
* "No LLM"
* "LLM"
* "LLM + Conf (Rand)"
* "LLM + Conf (Query)"
* "LLM + Conf (CT)"
* **Y-axis:** "Accuracy", with a scale ranging from approximately 0.2 to 1.0.
* **Horizontal Line:** A dashed red line at approximately y = 0.6.
* **Violin Plots:** Five violin plots, one for each category on the x-axis. Each violin plot shows the distribution of accuracy scores for that approach.
### Detailed Analysis
The violin plots show the distribution of accuracy scores for each approach.
* **No LLM (Blue):** The violin plot is centered around approximately 0.65, with a range from roughly 0.3 to 1.0. The plot is relatively wide, indicating a significant spread in accuracy scores.
* **LLM (Orange):** The violin plot is centered around approximately 0.6, with a range from roughly 0.3 to 0.9. It is slightly narrower than the "No LLM" plot.
* **LLM + Conf (Rand) (Green):** The violin plot is centered around approximately 0.7, with a range from roughly 0.4 to 0.95. It appears to have a slightly higher median than the previous two.
* **LLM + Conf (Query) (Red):** The violin plot is centered around approximately 0.55, with a range from roughly 0.3 to 0.8. It is narrower than the "No LLM" and "LLM" plots.
* **LLM + Conf (CT) (Purple):** The violin plot is centered around approximately 0.62, with a range from roughly 0.35 to 0.9. It is similar in shape to the "LLM" plot.
The dashed red line at approximately 0.6 appears to be a benchmark. The "No LLM", "LLM + Conf (Rand)", and "LLM + Conf (CT)" distributions largely exceed this line, while "LLM" and "LLM + Conf (Query)" have significant portions of their distributions below it.
### Key Observations
* The "LLM + Conf (Rand)" approach appears to have the highest median accuracy.
* The "LLM + Conf (Query)" approach appears to have the lowest median accuracy.
* The "No LLM" approach performs comparably to the "LLM + Conf (Rand)" and "LLM + Conf (CT)" approaches.
* The "LLM" approach performs slightly worse than the "No LLM" approach.
* There is considerable variability in accuracy scores within each approach, as indicated by the width of the violin plots.
### Interpretation
The data suggests that simply adding a Large Language Model (LLM) does not necessarily improve accuracy compared to not using one ("No LLM"). However, incorporating confidence measures with the LLM can impact performance, depending on the method used for calculating confidence. The "LLM + Conf (Rand)" approach, which likely uses a random confidence score, shows the highest accuracy. The "LLM + Conf (Query)" approach, which likely uses a query-based confidence score, performs the worst. This could indicate that the method for determining confidence is crucial for the effectiveness of the LLM. The horizontal line at 0.6 likely represents a passing threshold or a baseline performance level. The fact that some approaches consistently exceed this line suggests they are providing value. The variability within each approach suggests that the performance is not consistent and may depend on the specific questions being asked. Further investigation is needed to understand why the "LLM + Conf (Query)" approach performs so poorly and to optimize the confidence calculation method.