## Line Chart: Accuracy vs. Number of Sampled Reasoning Paths
### Overview
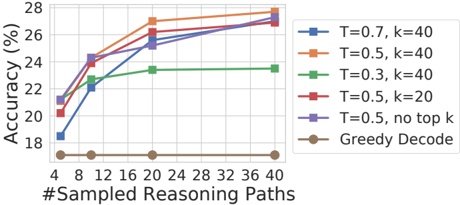
The image is a line chart comparing the accuracy (%) of different reasoning strategies against the number of sampled reasoning paths. The chart includes five different reasoning strategies, each represented by a distinct colored line, and a baseline "Greedy Decode" strategy. The x-axis represents the number of sampled reasoning paths, ranging from 4 to 40. The y-axis represents the accuracy in percentage, ranging from 18% to 28%.
### Components/Axes
* **X-axis:** "#Sampled Reasoning Paths" with tick marks at 4, 8, 12, 16, 20, 24, 28, 32, 36, and 40.
* **Y-axis:** "Accuracy (%)" with tick marks at 18, 20, 22, 24, 26, and 28.
* **Legend:** Located on the right side of the chart, it identifies each line by its color and corresponding reasoning strategy:
* Blue: T=0.7, k=40
* Orange: T=0.5, k=40
* Green: T=0.3, k=40
* Red: T=0.5, k=20
* Purple: T=0.5, no top k
* Brown: Greedy Decode
### Detailed Analysis
* **T=0.7, k=40 (Blue):** The line starts at approximately 18.5% accuracy with 4 sampled paths, increases to approximately 22.8% at 8 paths, reaches approximately 25% at 16 paths, and plateaus around 27% at 40 paths.
* **T=0.5, k=40 (Orange):** The line starts at approximately 21% accuracy with 4 sampled paths, increases to approximately 24.5% at 8 paths, reaches approximately 27% at 20 paths, and plateaus around 27.5% at 40 paths.
* **T=0.3, k=40 (Green):** The line starts at approximately 20.8% accuracy with 4 sampled paths, increases to approximately 22.8% at 12 paths, and plateaus around 23.5% at 40 paths.
* **T=0.5, k=20 (Red):** The line starts at approximately 20.2% accuracy with 4 sampled paths, increases to approximately 24.2% at 8 paths, reaches approximately 26% at 20 paths, and plateaus around 27% at 40 paths.
* **T=0.5, no top k (Purple):** The line starts at approximately 21% accuracy with 4 sampled paths, increases to approximately 24.5% at 12 paths, reaches approximately 26% at 40 paths.
* **Greedy Decode (Brown):** This line remains relatively flat at approximately 17% accuracy across all numbers of sampled reasoning paths.
### Key Observations
* The "Greedy Decode" strategy consistently performs worse than all other strategies.
* The strategies T=0.7, k=40 (Blue), T=0.5, k=40 (Orange), T=0.5, k=20 (Red), and T=0.5, no top k (Purple) show significant improvement in accuracy as the number of sampled reasoning paths increases, but they plateau after 20 sampled paths.
* The strategy T=0.3, k=40 (Green) shows a smaller increase in accuracy compared to the other strategies as the number of sampled reasoning paths increases.
### Interpretation
The data suggests that sampling multiple reasoning paths generally improves accuracy compared to the "Greedy Decode" baseline. The strategies with T=0.5 and T=0.7 appear to perform better than T=0.3. The parameter 'k' (likely representing a top-k sampling strategy) also seems to influence performance, although the "no top k" strategy performs comparably to the k=20 and k=40 strategies when T=0.5. The plateauing of accuracy after 20 sampled paths suggests diminishing returns for increasing the number of sampled paths beyond this point. The "Greedy Decode" strategy's consistently low performance indicates that exploring multiple reasoning paths is crucial for achieving higher accuracy in this context.