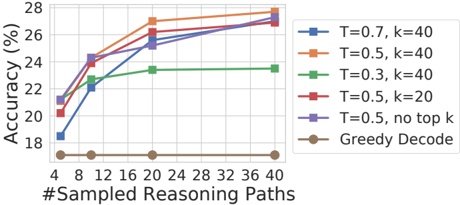
## Line Chart: Accuracy vs. Sampled Reasoning Paths
### Overview
This line chart depicts the relationship between the number of sampled reasoning paths and the resulting accuracy (in percentage) for different parameter settings (T and k). The chart compares several decoding strategies, including varying temperature (T) and top-k sampling (k) values, against a "Greedy Decode" baseline.
### Components/Axes
* **X-axis:** "#Sampled Reasoning Paths" with values: 4, 8, 12, 16, 20, 24, 28, 32, 36, 40.
* **Y-axis:** "Accuracy (%)" with a scale ranging from approximately 18% to 28%.
* **Legend:** Located in the top-right corner, listing the following data series:
* T = 0.7, k = 40 (Blue, Triangle Marker)
* T = 0.5, k = 40 (Orange, Square Marker)
* T = 0.3, k = 40 (Green, Diamond Marker)
* T = 0.5, k = 20 (Red, Triangle Down Marker)
* T = 0.5, no top k (Purple, Circle Marker)
* Greedy Decode (Brown, Circle Marker)
### Detailed Analysis
* **Greedy Decode (Brown):** This line remains relatively flat, starting at approximately 16% accuracy at 4 sampled paths and increasing slightly to around 17% at 40 sampled paths.
* **T = 0.5, no top k (Purple):** This line shows a steady increase in accuracy, starting at approximately 20% at 4 sampled paths and reaching around 26% at 40 sampled paths.
* **T = 0.5, k = 20 (Red):** This line exhibits a rapid increase in accuracy from approximately 21% at 4 sampled paths to around 27% at 20 sampled paths, then plateaus, remaining around 27% at 40 sampled paths.
* **T = 0.3, k = 40 (Green):** This line shows a moderate increase in accuracy, starting at approximately 21% at 4 sampled paths and reaching around 23% at 40 sampled paths.
* **T = 0.7, k = 40 (Blue):** This line demonstrates a significant increase in accuracy, starting at approximately 19% at 4 sampled paths and reaching around 27% at 40 sampled paths.
* **T = 0.5, k = 40 (Orange):** This line shows a strong increase in accuracy, starting at approximately 21% at 4 sampled paths and reaching around 27.5% at 20 sampled paths, then plateaus, remaining around 27.5% at 40 sampled paths.
### Key Observations
* Increasing the number of sampled reasoning paths generally improves accuracy for all decoding strategies except for Greedy Decode, which remains consistently low.
* The combination of T = 0.7 and k = 40 yields the highest accuracy, particularly at higher numbers of sampled paths.
* The "Greedy Decode" strategy consistently performs the worst across all sampled path values.
* The lines for T = 0.5, k = 40 (Orange) and T = 0.5, k = 20 (Red) show a plateau in accuracy after 20 sampled paths, suggesting diminishing returns beyond that point.
### Interpretation
The data suggests that employing sampling techniques (increasing the number of sampled reasoning paths) significantly improves the accuracy of the model compared to a greedy decoding approach. The temperature (T) and top-k (k) parameters play a crucial role in balancing exploration and exploitation during the decoding process. A higher temperature (T = 0.7) combined with a larger k value (k = 40) appears to be the most effective configuration for maximizing accuracy, indicating that allowing for more diverse reasoning paths leads to better results. The plateau observed in some lines suggests that there's a point of diminishing returns where increasing the number of sampled paths no longer provides substantial accuracy gains. This could be due to the model converging on a limited set of optimal reasoning paths. The consistently poor performance of "Greedy Decode" highlights the importance of exploration in the reasoning process, as it tends to get stuck in local optima.