## Line Chart: Delta MSC vs. Eta for Different Delta Values
### Overview
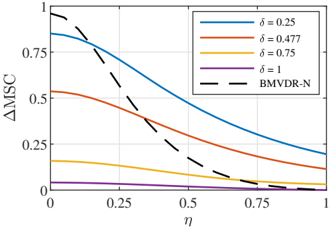
The image is a line chart showing the relationship between Delta MSC (ΔMSC) and Eta (η) for different values of Delta (δ). The chart includes multiple lines, each representing a different Delta value, and a line representing BMVDR-N. The chart illustrates how ΔMSC changes with η for each δ value and compares it to the BMVDR-N baseline.
### Components/Axes
* **Y-axis:** ΔMSC (Delta MSC), ranging from 0 to 1.0.
* Axis markers: 0, 0.25, 0.5, 0.75, 1
* **X-axis:** η (Eta), ranging from 0 to 1.0.
* Axis markers: 0, 0.25, 0.5, 0.75, 1
* **Legend:** Located in the top-right corner, identifying each line by its corresponding Delta value or as BMVDR-N.
* Blue line: δ = 0.25
* Red line: δ = 0.477
* Yellow line: δ = 0.75
* Purple line: δ = 1
* Black dashed line: BMVDR-N
### Detailed Analysis
* **Blue line (δ = 0.25):** Starts at approximately 0.85 at η = 0 and decreases to approximately 0.2 at η = 1. The line slopes downward.
* **Red line (δ = 0.477):** Starts at approximately 0.55 at η = 0 and decreases to approximately 0.05 at η = 1. The line slopes downward.
* **Yellow line (δ = 0.75):** Starts at approximately 0.25 at η = 0 and decreases to approximately 0 at η = 1. The line slopes downward.
* **Purple line (δ = 1):** Starts at approximately 0.1 at η = 0 and decreases to approximately 0 at η = 1. The line slopes downward.
* **Black dashed line (BMVDR-N):** Starts at approximately 1 at η = 0 and decreases to approximately 0 at η = 1. The line slopes downward.
### Key Observations
* As η increases, ΔMSC decreases for all values of δ.
* Higher values of δ generally correspond to lower values of ΔMSC for a given η.
* The BMVDR-N line shows a steeper decrease in ΔMSC compared to the lines representing fixed δ values.
### Interpretation
The chart illustrates the impact of Eta (η) on Delta MSC (ΔMSC) for different Delta (δ) values, and compares it to the BMVDR-N baseline. The data suggests that increasing Eta consistently reduces Delta MSC across all Delta values. The BMVDR-N line indicates a more rapid decrease in Delta MSC as Eta increases, suggesting a different relationship or sensitivity to Eta compared to the fixed Delta values. The chart demonstrates how the choice of Delta influences the relationship between Eta and Delta MSC.