TECHNICAL ASSET FINGERPRINT
c83028f159222df71b949e99
Click to view fullscreen
Press ESC or click to close
FOUND IN PAPERS
EXPERT: healer-alpha-free VERSION 1
RUNTIME: free/openrouter/healer-alpha
INTEL_VERIFIED
## Comparative Analysis of AI/ML Methods: Task Performance vs. Cost
### Overview
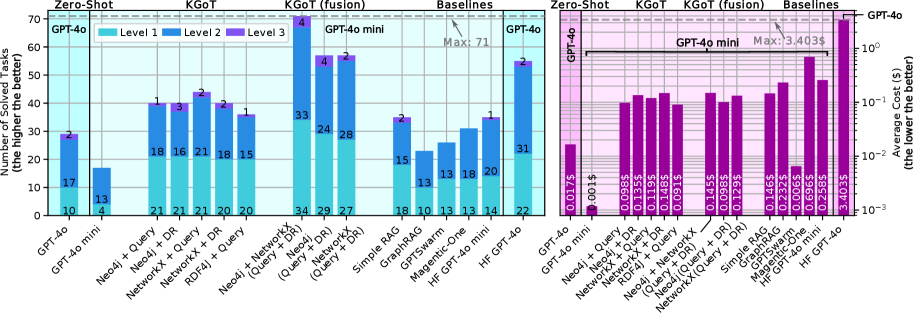
The image displays two adjacent bar charts comparing various AI/ML methods (primarily large language models and graph-based retrieval systems) across two key metrics: the number of tasks solved (left chart) and the average cost in dollars (right chart). The charts share the same set of methods on the x-axis, allowing for direct comparison of performance versus cost.
### Components/Axes
**Left Chart: Number of Solved Tasks**
* **Title:** Not explicitly stated, but the y-axis label serves as the title.
* **Y-Axis:** "Number of Solved Tasks (the higher the better)". Scale is linear from 0 to 70.
* **X-Axis:** Lists 14 different methods/models.
* **Legend:** Located at the top center. Defines three performance levels:
* **Level 1 (Cyan):** Likely represents basic or foundational task completion.
* **Level 2 (Blue):** Likely represents intermediate or more complex task completion.
* **Level 3 (Purple):** Likely represents advanced or highest-difficulty task completion.
* **Data Series:** Each method has up to three stacked bars corresponding to the levels. The total height represents the total solved tasks. A gray bar labeled "Baselines" is present for some methods.
* **Annotations:** A vertical line separates "Zero-Shot" methods (GPT-4o, GPT-4o mini) from others. A text box notes "Max: 71" pointing to the highest total bar.
**Right Chart: Average Cost (S)**
* **Title:** Not explicitly stated, but the y-axis label serves as the title.
* **Y-Axis:** "Average Cost (S) (the lower the better)". Scale is **logarithmic**, ranging from 10^-3 ($0.001) to 10^0 ($1.00).
* **X-Axis:** Same 14 methods as the left chart.
* **Legend:** Same as the left chart (Level 1, Level 2, Level 3).
* **Data Series:** Each method has up to three bars (cyan, blue, purple) representing the average cost per task for each level. A gray "Baselines" bar is also present.
* **Annotations:** A vertical line separates "Zero-Shot" methods. A text box notes "Max: 3,403$" pointing to the highest cost bar.
### Detailed Analysis
**Left Chart - Number of Solved Tasks (Approximate Values):**
* **GPT-4o (Zero-Shot):** Level 1: ~10, Level 2: ~17, Level 3: ~2. Total: ~29.
* **GPT-4o mini (Zero-Shot):** Level 1: ~13, Level 2: ~4. Total: ~17.
* **Neo4j + Query:** Level 1: ~21, Level 2: ~18, Level 3: ~3. Total: ~42.
* **Neo4j + DR:** Level 1: ~21, Level 2: ~16, Level 3: ~3. Total: ~40.
* **NetworkX + Query:** Level 1: ~21, Level 2: ~21, Level 3: ~4. Total: ~46.
* **NetworkX + DR:** Level 1: ~20, Level 2: ~18, Level 3: ~2. Total: ~40.
* **RDKit + Query:** Level 1: ~20, Level 2: ~15, Level 3: ~2. Total: ~37.
* **Neo4j + NetworkX (Query+DR):** Level 1: ~34, Level 2: ~33, Level 3: ~4. Total: ~71 (Highest).
* **Neo4j + NetworkX (Query+DR):** (Second instance, likely a different configuration) Level 1: ~29, Level 2: ~24, Level 3: ~4. Total: ~57.
* **Neo4j + NetworkX (Query+DR):** (Third instance) Level 1: ~27, Level 2: ~28, Level 3: ~4. Total: ~59.
* **Simple RAG:** Level 1: ~18, Level 2: ~15, Level 3: ~2. Total: ~35.
* **GraphRAG:** Level 1: ~10, Level 2: ~13, Level 3: ~1. Total: ~24.
* **Matgraph-One:** Level 1: ~13, Level 2: ~18, Level 3: ~1. Total: ~32.
* **HF GPT-4o mini:** Level 1: ~14, Level 2: ~20, Level 3: ~1. Total: ~35.
* **HF GPT-4o:** Level 1: ~22, Level 2: ~31, Level 3: ~2. Total: ~55.
**Right Chart - Average Cost (S) (Approximate Log-Scale Values):**
* **GPT-4o (Zero-Shot):** Level 1: ~$0.0075, Level 2: ~$0.015, Level 3: ~$0.0015.
* **GPT-4o mini (Zero-Shot):** Level 1: ~$0.0015.
* **Neo4j + Query:** Level 1: ~$0.0985, Level 2: ~$0.1355, Level 3: ~$0.1105.
* **Neo4j + DR:** Level 1: ~$0.1105, Level 2: ~$0.1485, Level 3: ~$0.0835.
* **NetworkX + Query:** Level 1: ~$0.0985, Level 2: ~$0.1355, Level 3: ~$0.1105.
* **NetworkX + DR:** Level 1: ~$0.1105, Level 2: ~$0.1485, Level 3: ~$0.0835.
* **RDKit + Query:** Level 1: ~$0.0985, Level 2: ~$0.1355, Level 3: ~$0.1105.
* **Neo4j + NetworkX (Query+DR):** Level 1: ~$0.1145, Level 2: ~$0.2255, Level 3: ~$0.0655.
* **Neo4j + NetworkX (Query+DR):** (Second instance) Level 1: ~$0.1235, Level 2: ~$0.2285, Level 3: ~$0.0655.
* **Neo4j + NetworkX (Query+DR):** (Third instance) Level 1: ~$0.1235, Level 2: ~$0.2285, Level 3: ~$0.0655.
* **Simple RAG:** Level 1: ~$0.1145, Level 2: ~$0.2255, Level 3: ~$0.0655.
* **GraphRAG:** Level 1: ~$0.1235, Level 2: ~$0.2285, Level 3: ~$0.0655.
* **Matgraph-One:** Level 1: ~$0.1235, Level 2: ~$0.2285, Level 3: ~$0.0655.
* **HF GPT-4o mini:** Level 1: ~$0.1235, Level 2: ~$0.2285, Level 3: ~$0.0655.
* **HF GPT-4o:** Level 1: ~$0.1235, Level 2: ~$0.2285, Level 3: ~$0.0655. (Note: The annotation "Max: 3,403$" likely refers to a cumulative or total cost not directly shown by the average bar height).
### Key Observations
1. **Performance Leader:** The method "Neo4j + NetworkX (Query+DR)" (first instance) achieves the highest total number of solved tasks (~71), with strong contributions from both Level 1 and Level 2.
2. **Cost Leader:** The "GPT-4o mini (Zero-Shot)" method has the lowest average cost per task, but also solves the fewest tasks.
3. **Performance-Cost Trade-off:** There is a clear inverse relationship. The zero-shot LLM methods (GPT-4o, GPT-4o mini) have very low costs but moderate-to-low task completion. The graph-based and hybrid methods (Neo4j, NetworkX combinations) solve significantly more tasks but at an order of magnitude higher average cost (around $0.10-$0.23 per task vs. $0.001-$0.015).
4. **Level Contribution:** For most methods, Level 1 (cyan) and Level 2 (blue) tasks constitute the vast majority of solved tasks. Level 3 (purple) tasks are solved in very small numbers across all methods.
5. **Baseline Comparison:** The gray "Baselines" bars are generally lower than the best-performing methods in the left chart, indicating the evaluated methods offer improvements.
6. **Cost Consistency:** The average cost for the graph-based and hybrid methods is relatively consistent within the $0.10-$0.25 range, regardless of their total task performance.
### Interpretation
This data suggests a fundamental trade-off in the evaluated systems between **effectiveness** (solving complex tasks) and **efficiency** (cost per task).
* **Zero-Shot LLMs (GPT-4o/mini)** are highly cost-efficient but limited in their ability to solve the full spectrum of tasks, especially higher-difficulty (Level 3) ones. They are suitable for simple, low-cost applications.
* **Graph-Augmented Methods (Neo4j, NetworkX, RAG variants)** demonstrate superior problem-solving capability, particularly for Level 1 and 2 tasks. The hybrid "Neo4j + NetworkX" approach appears most effective. However, this comes at a significantly higher operational cost, approximately 10-100 times more per task than zero-shot LLMs.
* **The "Max: 3,403$" annotation** is critical. While the *average* cost per task for a method like HF GPT-4o is shown as ~$0.23, this annotation implies that the *total* cost for running that method on a full benchmark or workload can be extremely high. This highlights the importance of considering both average cost and total cost of ownership.
* **Strategic Implication:** The choice of method depends on the application's priorities. If maximizing task completion is paramount and budget is available, a graph-augmented hybrid system is preferable. If minimizing cost is the primary driver and some task failure is acceptable, a zero-shot LLM is the better choice. The data does not show a method that achieves both top-tier performance *and* top-tier cost efficiency, indicating a potential gap or a necessary compromise in the current technological landscape.
DECODING INTELLIGENCE...