\n
## Line Chart: Scaling Laws: First Pit
### Overview
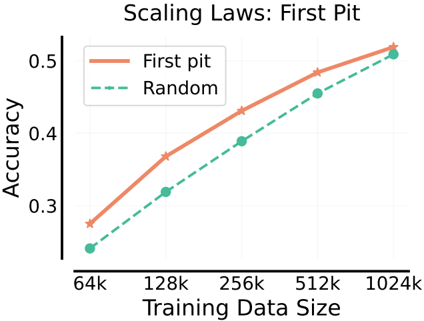
This image presents a line chart illustrating the relationship between Training Data Size and Accuracy for two different methods: "First pit" and "Random". The chart demonstrates how accuracy improves with increasing training data size for both methods, with "First pit" consistently achieving higher accuracy.
### Components/Axes
* **Title:** Scaling Laws: First Pit (positioned at the top-center)
* **X-axis:** Training Data Size (labeled at the bottom-center). Markers are: 64k, 128k, 256k, 512k, 1024k.
* **Y-axis:** Accuracy (labeled on the left-side). Scale ranges from approximately 0.25 to 0.55.
* **Legend:** Located in the top-left corner.
* "First pit" - represented by a solid orange line.
* "Random" - represented by a dashed teal line.
### Detailed Analysis
**First Pit (Orange Line):**
The orange line slopes upward, indicating a positive correlation between Training Data Size and Accuracy.
* At 64k Training Data Size, Accuracy is approximately 0.27.
* At 128k Training Data Size, Accuracy is approximately 0.34.
* At 256k Training Data Size, Accuracy is approximately 0.42.
* At 512k Training Data Size, Accuracy is approximately 0.47.
* At 1024k Training Data Size, Accuracy is approximately 0.54.
**Random (Teal Dashed Line):**
The teal dashed line also slopes upward, but less steeply than the orange line.
* At 64k Training Data Size, Accuracy is approximately 0.23.
* At 128k Training Data Size, Accuracy is approximately 0.31.
* At 256k Training Data Size, Accuracy is approximately 0.39.
* At 512k Training Data Size, Accuracy is approximately 0.45.
* At 1024k Training Data Size, Accuracy is approximately 0.52.
### Key Observations
* The "First pit" method consistently outperforms the "Random" method across all Training Data Sizes.
* The rate of accuracy improvement diminishes as the Training Data Size increases for both methods. The curve appears to be flattening out at larger data sizes.
* The difference in accuracy between the two methods is most pronounced at smaller Training Data Sizes (64k and 128k).
### Interpretation
The chart demonstrates the impact of training data size on model accuracy for two different approaches. The "First pit" method exhibits superior scaling behavior, meaning it benefits more significantly from increased training data compared to the "Random" method. This suggests that the "First pit" method is more data-efficient or better suited to leverage larger datasets. The diminishing returns observed at larger data sizes indicate a potential point of saturation, where further increases in training data yield progressively smaller improvements in accuracy. This information is valuable for resource allocation and model development, as it helps determine the optimal amount of training data needed to achieve desired performance levels. The chart implies that the "First pit" method is a more effective strategy for improving accuracy, especially when data is limited.