\n
## Line Chart: Heuristic Matching of Packages Over Time (2018-2023)
### Overview
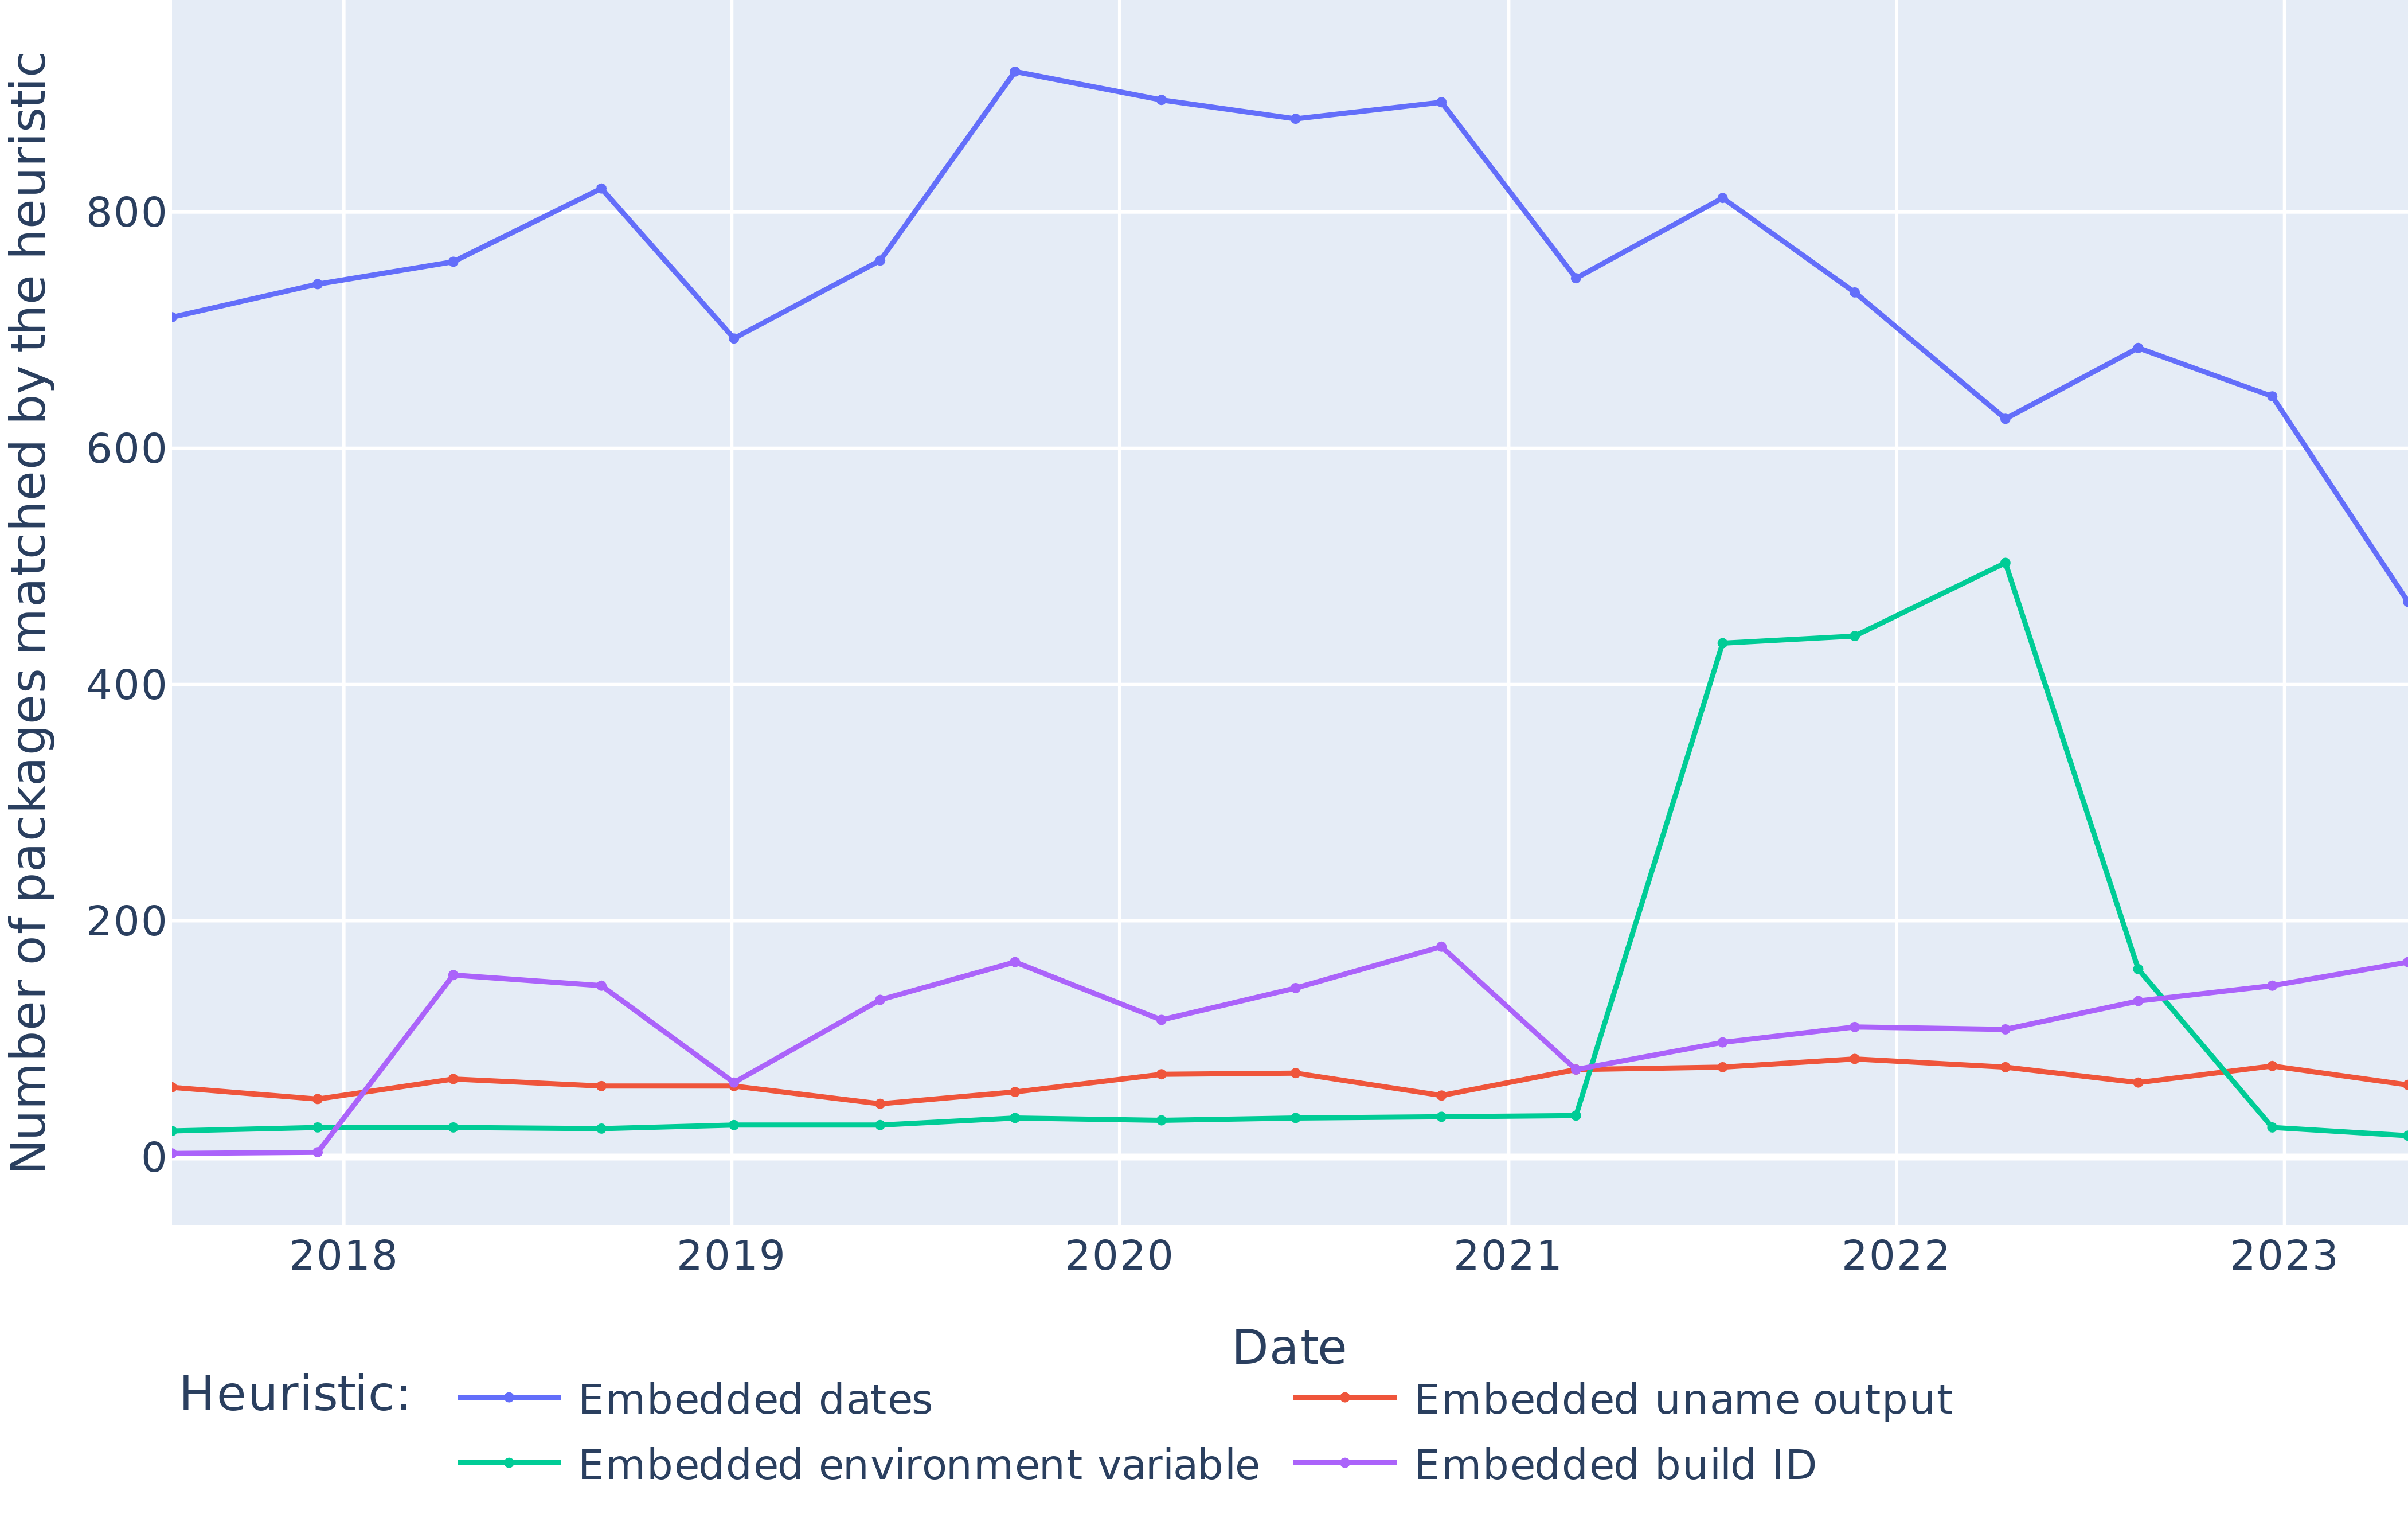
This is a line chart tracking the number of software packages matched by four different detection heuristics over a period from approximately early 2018 to late 2023. The chart visualizes trends in how frequently certain types of embedded information are found within packages over time.
### Components/Axes
* **Chart Type:** Multi-line chart.
* **X-Axis (Horizontal):** Labeled "Date". It displays yearly time markers: 2018, 2019, 2020, 2021, 2022, 2023. The axis appears to have quarterly or semi-annual data points between the year labels.
* **Y-Axis (Vertical):** Labeled "Number of packages matched by the heuristic". The scale runs from 0 to 800, with major gridlines at intervals of 200 (0, 200, 400, 600, 800).
* **Legend:** Positioned at the bottom center of the chart, below the x-axis label. It is titled "Heuristic:" and defines four data series:
* **Blue Line:** "Embedded dates"
* **Red/Orange Line:** "Embedded uname output"
* **Green Line:** "Embedded environment variable"
* **Purple Line:** "Embedded build ID"
### Detailed Analysis
**1. Embedded dates (Blue Line):**
* **Trend & Position:** This is the dominant series, consistently positioned at the top of the chart. It shows a general upward trend from 2018 to a peak around 2020, followed by a gradual decline through 2023.
* **Approximate Data Points:**
* Early 2018: ~710
* Mid-2018: ~760
* Early 2019: ~820 (local peak)
* Mid-2019: ~690 (dip)
* Early 2020: ~920 (global peak)
* Mid-2020: ~890
* Early 2021: ~890
* Mid-2021: ~740
* Early 2022: ~810
* Mid-2022: ~730
* Early 2023: ~620
* Mid-2023: ~680
* Late 2023: ~470
**2. Embedded environment variable (Green Line):**
* **Trend & Position:** This series is near the bottom (close to 0) for most of the timeline but exhibits a dramatic, isolated spike.
* **Approximate Data Points:**
* 2018 to early 2022: Remains very low, fluctuating between ~20 and ~30.
* Mid-2022: Sharp increase to ~430.
* Late 2022: Peaks at ~500.
* Early 2023: Drops sharply to ~160.
* Mid-2023: Falls back to baseline levels (~20).
**3. Embedded build ID (Purple Line):**
* **Trend & Position:** This series occupies the lower-middle range of the chart, showing moderate fluctuations.
* **Approximate Data Points:**
* Early 2018: ~0
* Mid-2018: ~155
* Early 2019: ~145
* Mid-2019: ~60 (dip)
* Early 2020: ~165
* Mid-2020: ~115
* Early 2021: ~175
* Mid-2021: ~70
* Early 2022: ~95
* Mid-2022: ~110
* Early 2023: ~105
* Mid-2023: ~130
* Late 2023: ~165
**4. Embedded uname output (Red/Orange Line):**
* **Trend & Position:** This is the most stable series, forming a nearly flat line near the bottom of the chart.
* **Approximate Data Points:** Consistently hovers between ~40 and ~80 throughout the entire period, with no significant peaks or valleys.
### Key Observations
1. **Dominance of Dates:** The "Embedded dates" heuristic matches significantly more packages than all others combined for the entire observed period, indicating timestamps are a very common artifact in packages.
2. **Anomalous Spike:** The "Embedded environment variable" heuristic shows a massive, temporary surge in matches during 2022, suggesting a specific event, widespread adoption of a new build practice, or a change in the heuristic's detection capability during that window.
3. **Stability of uname:** The "Embedded uname output" shows remarkable consistency, implying the inclusion of system information (like `uname -a` output) is a stable, low-frequency practice in package creation.
4. **Build ID Volatility:** The "Embedded build ID" shows more volatility than uname but less than the environment variable spike, suggesting its usage is somewhat variable but not tied to a single major event.
### Interpretation
This chart likely analyzes metadata or build artifacts within software packages (e.g., from repositories like npm, PyPI, or container images) to understand common fingerprinting or information leakage patterns.
* **What the data suggests:** The high prevalence of embedded dates points to build timestamps or file modification dates being routinely included. The 2022 spike in environment variables could correlate with a shift in CI/CD practices, a new popular toolchain that embeds such data, or a security research focus that led to better detection. The low, stable rate of `uname` output suggests it's a known but less common practice, possibly avoided due to security or reproducibility concerns.
* **Relationships:** The heuristics are independent detection methods. Their relative frequencies show which types of embedded data are most "noisy" or common. The spike in one heuristic (environment variable) does not correspond to a change in the others, indicating it was driven by a unique factor.
* **Notable Anomalies:** The 2022 environment variable spike is the primary anomaly. Its sharp rise and fall suggest a transient phenomenon rather than a permanent trend change. The consistent gap between "Embedded dates" and all other heuristics is a significant and persistent pattern.