## Bar Chart: CoT with 60 steps, TV 0.231
### Overview
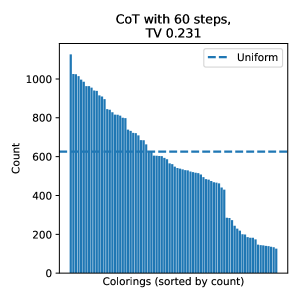
The image is a bar chart visualizing the distribution of "Colorings" (sorted by count) with a total variation (TV) distance of 0.231 from a uniform distribution. The chart includes a horizontal dashed line labeled "Uniform" at approximately 600 on the y-axis, serving as a reference for comparison.
### Components/Axes
- **Title**: "CoT with 60 steps, TV 0.231" (top-center).
- **Y-Axis**: Labeled "Count" with a linear scale from 0 to 1000.
- **X-Axis**: Labeled "Colorings (sorted by count)" with discrete, unlabeled categories ordered left-to-right by descending count.
- **Legend**: Located in the top-right corner, with a dashed blue line labeled "Uniform".
- **Data Series**: Blue bars representing counts for each coloring, decreasing in height from left to right.
### Detailed Analysis
- **Uniform Reference Line**: A horizontal dashed blue line at y ≈ 600, spanning the entire x-axis.
- **Bar Heights**:
- First bar (leftmost): ~1000.
- Subsequent bars decrease stepwise: ~900, ~800, ~700, ~600, ~500, ~400, ~300, ~200, ~100 (rightmost).
- The final 5 bars are barely visible above the baseline.
- **Total Variation (TV)**: Explicitly stated as 0.231 in the title, indicating the magnitude of deviation from uniformity.
### Key Observations
1. **Decreasing Trend**: Counts drop sharply from ~1000 to ~100 across the x-axis, with no category exceeding the uniform reference line (~600) except the first few bars.
2. **Outlier**: The first bar (~1000) is significantly higher than the uniform baseline, suggesting a concentration of counts in early colorings.
3. **TV Interpretation**: A TV of 0.231 implies moderate deviation from uniformity, as TV ranges from 0 (perfect uniformity) to 1 (maximum disparity).
### Interpretation
The chart demonstrates that the distribution of colorings is heavily skewed toward the first few categories, with counts declining rapidly. The uniform reference line (~600) acts as a benchmark, highlighting that early colorings dominate the distribution. The TV value of 0.231 quantifies this skew, indicating that the process (likely a computational or algorithmic method with 60 steps) produces a non-uniform outcome. The sharp decline suggests diminishing returns or inefficiencies in later steps, while the high initial counts may reflect optimal or frequently occurring configurations. The uniform line’s placement at 600 could represent an expected baseline, but the actual data deviates significantly, emphasizing the importance of the first few colorings in this context.