\n
## Diagram: LSTM Cell Structure
### Overview
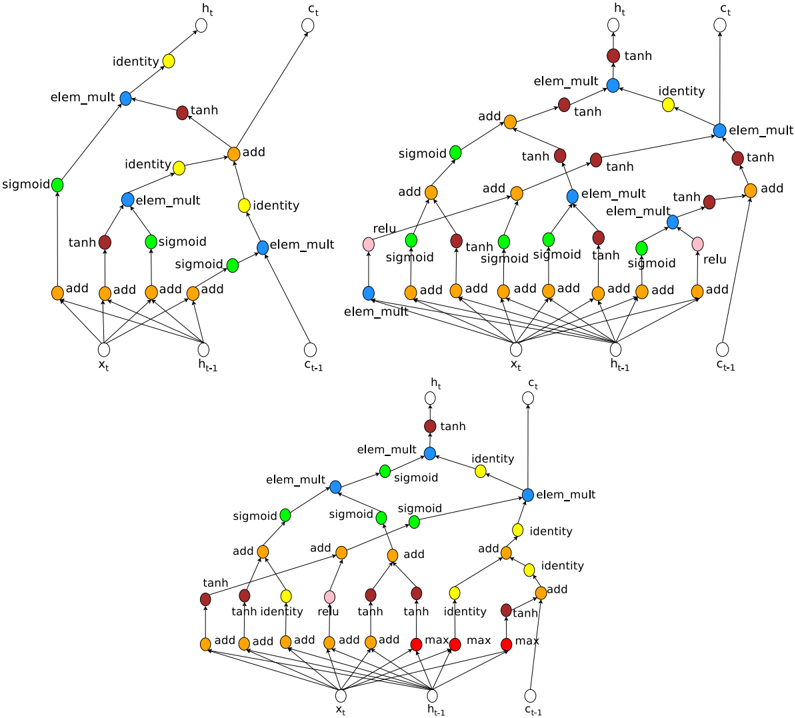
The image depicts three variations of the Long Short-Term Memory (LSTM) cell structure, a type of recurrent neural network architecture. Each cell diagram illustrates the flow of information through various gates and operations. The diagrams are arranged in a 3x1 grid, with the top diagram being the most simplified, the middle diagram being more complex, and the bottom diagram being the most complex.
### Components/Axes
The diagrams utilize the following components:
* **Nodes:** Representing data values (x<sub>t</sub>, h<sub>t</sub>, c<sub>t</sub>, n<sub>t-1</sub>, c<sub>t-1</sub>).
* **Operations:** Represented by labeled circles or boxes (add, sigmoid, tanh, relu, max, elem\_mult, identity).
* **Connections:** Lines with arrows indicating the direction of data flow.
* **Input:** x<sub>t</sub>
* **Previous Hidden State:** h<sub>t-1</sub>
* **Previous Cell State:** c<sub>t-1</sub>
* **Current Hidden State:** h<sub>t</sub>
* **Current Cell State:** c<sub>t</sub>
### Detailed Analysis or Content Details
**Top LSTM Cell:**
* **Inputs:** x<sub>t</sub>, h<sub>t-1</sub>, c<sub>t-1</sub>
* **Operations:**
* Multiple "add" operations combining inputs.
* "sigmoid" activations.
* "tanh" activations.
* "elem\_mult" (element-wise multiplication).
* "identity" connections (direct pass-through).
* **Outputs:** h<sub>t</sub>, c<sub>t</sub>
* **Flow:** x<sub>t</sub> and h<sub>t-1</sub> are combined through multiple "add" operations and passed through "sigmoid" and "tanh" activations. These outputs are then combined with c<sub>t-1</sub> via "elem\_mult" and "add" operations to produce c<sub>t</sub>. h<sub>t</sub> is derived from a similar pathway.
**Middle LSTM Cell:**
* **Inputs:** x<sub>t</sub>, h<sub>t-1</sub>, c<sub>t-1</sub>
* **Operations:**
* Multiple "add" operations.
* "sigmoid" activations.
* "tanh" activations.
* "relu" activations.
* "elem\_mult" (element-wise multiplication).
* "identity" connections.
* **Outputs:** h<sub>t</sub>, c<sub>t</sub>
* **Flow:** Similar to the top cell, but with the addition of "relu" activations and a more complex network of "add" and "elem\_mult" operations.
**Bottom LSTM Cell:**
* **Inputs:** x<sub>t</sub>, h<sub>t-1</sub>, c<sub>t-1</sub>
* **Operations:**
* Multiple "add" operations.
* "sigmoid" activations.
* "tanh" activations.
* "relu" activations.
* "max" operations.
* "elem\_mult" (element-wise multiplication).
* "identity" connections.
* **Outputs:** h<sub>t</sub>, c<sub>t</sub>
* **Flow:** The most complex of the three, featuring "max" operations alongside the other operations. The flow is highly interconnected, with multiple pathways for data to travel through.
### Key Observations
* The complexity of the LSTM cell increases from top to bottom.
* All three cells share the core components of "add", "sigmoid", "tanh", "elem\_mult", and "identity" operations.
* The addition of "relu" and "max" operations in the lower cells suggests more sophisticated gate mechanisms.
* The diagrams illustrate the core principle of LSTM cells: maintaining and updating a cell state (c<sub>t</sub>) while selectively allowing information to flow through gates controlled by sigmoid activations.
### Interpretation
The diagrams demonstrate the evolution of the LSTM cell architecture. The top diagram represents a simplified version, while the middle and bottom diagrams showcase increasingly complex implementations designed to improve the cell's ability to learn long-term dependencies in sequential data. The addition of "relu" and "max" operations likely contributes to more nuanced gate control and improved performance. The diagrams highlight the core concept of LSTM cells: the use of gates to regulate the flow of information, enabling the network to selectively remember or forget information over time. The consistent presence of x<sub>t</sub>, h<sub>t-1</sub>, and c<sub>t-1</sub> as inputs and h<sub>t</sub> and c<sub>t</sub> as outputs across all three diagrams emphasizes the fundamental input-output relationship of the LSTM cell. The diagrams are not providing specific numerical data, but rather a visual representation of the computational structure of the LSTM cell. They are conceptual diagrams, not charts or graphs.