## Heatmap: Fixed Recurrence Seed 1 Analysis
### Overview
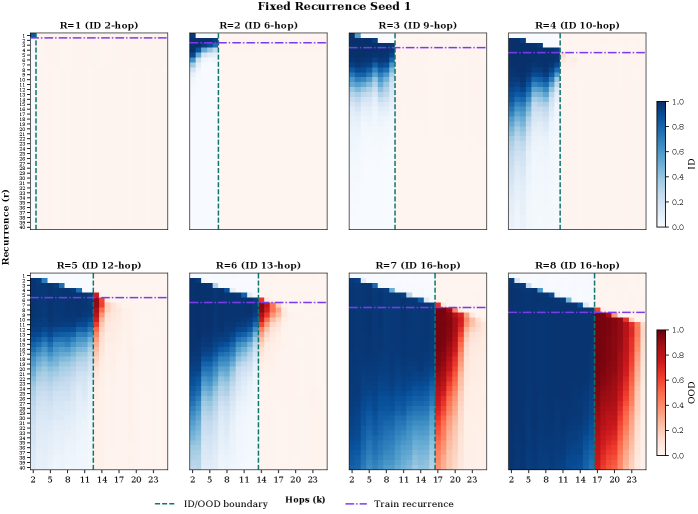
The image displays a matrix of heatmaps organized in two rows, each representing different recurrence depths (R=1 to R=8) and their corresponding in-distribution (ID) hop counts (2-hop to 16-hop). The heatmaps visualize out-of-distribution (OOD) detection performance across recurrence steps (r) and hops (k), with color intensity indicating OOD probability (0.0 to 1.0). Key elements include:
- Vertical dashed green line: ID/OOD boundary
- Purple dashed line: Train recurrence threshold
- Color scale: Blue (low OOD) to Red (high OOD)
### Components/Axes
1. **Vertical Axis (Recurrence r)**:
- Labeled "Recurrence (r)"
- Scale: 1 to 40 (discrete steps)
- Position: Left side of all panels
2. **Horizontal Axis (Hops k)**:
- Labeled "Hops (k)"
- Scale: 2 to 23 (discrete steps)
- Position: Bottom of all panels
3. **Legend**:
- Located on the right side
- Color bar: 0.0 (lightest) to 1.0 (darkest red)
- Label: "OOD"
4. **Panel Labels**:
- Top row: R=1 (ID 2-hop), R=2 (ID 6-hop), R=3 (ID 9-hop), R=4 (ID 10-hop)
- Bottom row: R=5 (ID 12-hop), R=6 (ID 13-hop), R=7 (ID 16-hop), R=8 (ID 16-hop)
- Position: Top-center of each panel
### Detailed Analysis
1. **R=1 (ID 2-hop)**:
- Single dark blue cell at (r=1, k=2)
- All other cells: Near-white (OOD ≈ 0.0)
2. **R=2 (ID 6-hop)**:
- Dark blue region in top-left (r=1-5, k=2-6)
- Gradual transition to lighter blue toward OOD boundary
3. **R=3 (ID 9-hop)**:
- Dark blue region expands to r=1-10, k=2-9
- Diagonal gradient toward OOD boundary
4. **R=4 (ID 10-hop)**:
- Dark blue region covers r=1-15, k=2-10
- Stronger gradient toward OOD boundary
5. **R=5 (ID 12-hop)**:
- Dark blue region spans r=1-20, k=2-12
- First appearance of red cells near OOD boundary (r=20-25, k=12-15)
6. **R=6 (ID 13-hop)**:
- Dark blue region extends to r=1-25, k=2-13
- Red cells appear in r=25-30, k=13-16
7. **R=7 (ID 16-hop)**:
- Dark blue region covers r=1-30, k=2-16
- Red cells dominate r=30-35, k=16-20
8. **R=8 (ID 16-hop)**:
- Dark blue region spans r=1-35, k=2-16
- Red cells occupy r=35-40, k=16-23
### Key Observations
1. **ID/OOD Boundary**:
- Consistent vertical position across all panels
- Separates ID (left) from OOD (right)
2. **Train Recurrence Threshold**:
- Purple dashed line at r=15-20 (varies slightly by panel)
- All panels show similar threshold positioning
3. **OOD Intensity Trends**:
- Higher R values show:
- Larger ID regions (more dark blue)
- Stronger OOD gradients (darker red near boundary)
- Diagonal bands of high OOD (red) appear in:
- R=5: k=12-15, r=20-25
- R=6: k=13-16, r=25-30
- R=7: k=16-20, r=30-35
- R=8: k=16-23, r=35-40
4. **Recurrence-Hops Correlation**:
- Higher R values correlate with:
- Increased ID region size
- More pronounced OOD gradients
- Diagonal bands suggest recurrence-hops interaction in OOD detection
### Interpretation
The data demonstrates that:
1. **Recurrence Depth Impact**:
- Deeper recurrences (higher R) create larger ID regions
- OOD detection becomes more gradient-like with increasing R
2. **Hop Recurrence Interaction**:
- Diagonal bands indicate that certain (r,k) combinations are more prone to OOD
- This suggests recurrence-hops co-dependency in model representations
3. **Threshold Behavior**:
- Train recurrence threshold (purple line) aligns with:
- Transition from ID to OOD regions
- Emergence of red cells in higher R panels
4. **Model Complexity Insights**:
- Larger ID regions in higher R panels may indicate:
- Better ID representation
- Potential overfitting to ID data
- Red cells near OOD boundary suggest:
- Model uncertainty thresholds
- Possible mode collapse in OOD regions
The visualization reveals that recurrence depth significantly influences OOD detection patterns, with deeper recurrences creating more complex ID/OOD boundaries and stronger gradient transitions. The diagonal bands of high OOD values suggest that specific recurrence-hops combinations create particularly vulnerable model representations.