## Diagram: Reidemeister Move 2
### Overview
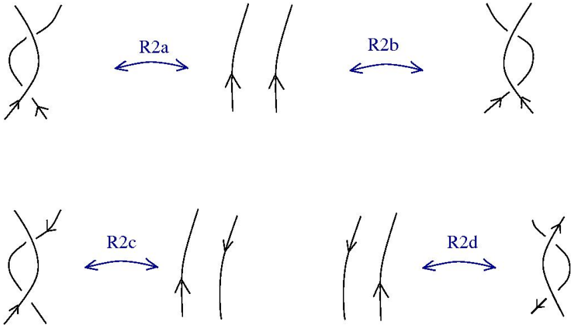
The image depicts the Reidemeister move of type 2 (R2), showing four variations (R2a, R2b, R2c, R2d) of this move. Each variation illustrates the equivalence between a knot diagram with two crossings and a diagram with two parallel strands. The arrows on the strands indicate the orientation.
### Components/Axes
* **Strands:** Represented by curved lines with arrows indicating orientation.
* **Crossings:** Points where strands intersect.
* **Arrows:** Indicate the direction of the strands.
* **Labels:** R2a, R2b, R2c, R2d, each associated with a specific variation of the move.
* **Double-headed Arrows:** Indicate the equivalence between the diagrams on either side.
### Detailed Analysis
The image is divided into two rows, each containing two variations of the Reidemeister move 2.
**Top Row:**
* **R2a:** A knot diagram with two crossings on the left is equivalent to two parallel strands on the right. The double-headed arrow labeled "R2a" connects the two diagrams.
* **R2b:** Two parallel strands on the left are equivalent to a knot diagram with two crossings on the right. The double-headed arrow labeled "R2b" connects the two diagrams.
**Bottom Row:**
* **R2c:** A knot diagram with two crossings on the left is equivalent to two parallel strands on the right. The double-headed arrow labeled "R2c" connects the two diagrams.
* **R2d:** Two parallel strands on the left are equivalent to a knot diagram with two crossings on the right. The double-headed arrow labeled "R2d" connects the two diagrams.
In each case, the arrows on the strands indicate the orientation. The crossings in the knot diagrams are oriented such that one strand passes over the other.
### Key Observations
* The Reidemeister move 2 (R2) demonstrates the equivalence between a knot diagram with two crossings and a diagram with two parallel strands.
* The variations R2a and R2b are mirror images of each other, as are R2c and R2d.
* The arrows on the strands indicate the orientation, which is preserved during the move.
### Interpretation
The Reidemeister moves are a set of local moves that can be applied to a knot diagram without changing the knot itself. The Reidemeister move 2 (R2) is one of these moves, and it demonstrates the equivalence between a knot diagram with two crossings and a diagram with two parallel strands. This move is important because it allows us to simplify knot diagrams and to prove that two knot diagrams represent the same knot. The variations R2a, R2b, R2c, and R2d show different orientations of the strands, but the underlying principle remains the same.