## Diagram: Network of Numbered Nodes
### Overview
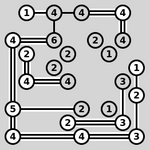
The image depicts a network of interconnected nodes, each containing a number. The nodes are connected by lines, some of which are doubled. The background is a light gray.
### Components/Axes
* **Nodes:** Circular shapes containing numbers. The numbers range from 1 to 6. Some nodes are shaded gray.
* **Connections:** Lines connecting the nodes. Some connections are doubled, indicating a stronger or different type of relationship.
* **Background:** Light gray.
### Detailed Analysis
The diagram consists of nodes with the following values: 1, 2, 3, 4, 5, and 6. The nodes are arranged in a somewhat irregular pattern.
* **Top Row:** From left to right: Node "1", Node "4", Node "4", Node "4".
* **Second Row:** Node "4", Node "6", Node "2", Node "2", Node "1", Node "4".
* **Third Row:** Node "4", Node "2", Node "2", Node "4".
* **Fourth Row:** Node "5", Node "2", Node "1", Node "3".
* **Fifth Row:** Node "4", Node "4", Node "3".
* **Sixth Row:** Node "1", Node "3", Node "2".
The connections between the nodes are as follows:
* Node "1" (top-left) is connected to Node "4".
* Node "4" (top-left) is connected to Node "1", Node "4", and Node "6".
* Node "4" (top-middle) is connected to Node "4".
* Node "4" (top-right) is connected to Node "4".
* Node "4" (left-side) is connected to Node "6", Node "2", Node "4", and Node "5".
* Node "6" is connected to Node "4".
* Node "5" is connected to Node "4", Node "2".
* Node "4" (bottom-left) is connected to Node "5", Node "4".
* Node "4" (bottom-middle) is connected to Node "4", Node "3".
* Node "3" (bottom-right) is connected to Node "4", Node "3".
* Node "3" (right-side) is connected to Node "3", Node "2", Node "1".
### Key Observations
* The number "4" appears most frequently as a node value.
* Some connections are doubled, suggesting a different type of relationship or a stronger connection.
* The nodes are not arranged in a regular grid or pattern.
### Interpretation
The diagram likely represents a network or system where the nodes represent entities or states, and the numbers represent some attribute or value associated with those entities. The connections represent relationships or interactions between the entities. The doubled connections could indicate stronger or more frequent interactions. Without further context, it's difficult to determine the specific meaning of the numbers and connections. The diagram could be used to model various systems, such as social networks, transportation networks, or computer networks.