## Heatmaps: Watts Strogatz and Newman Watts Strogatz Graphs
### Overview
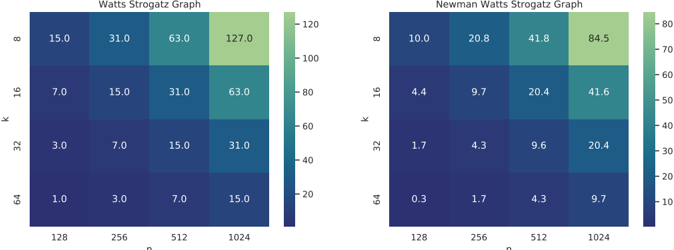
The image presents two heatmaps side-by-side, comparing data for "Watts Strogatz Graph" (left) and "Newman Watts Strogatz Graph" (right). Both heatmaps visualize a relationship between two variables, 'k' and 'n', with color intensity representing a numerical value. Each heatmap has a color scale indicating the mapping between color and value.
### Components/Axes
Both heatmaps share the same axes labels and structure:
* **X-axis:** 'n' with values 128, 256, 512, and 1024.
* **Y-axis:** 'k' with values 8, 16, 32, and 64.
* **Color Scale:** A gradient from dark blue (low values) to light green (high values). The scale ranges from approximately 0 to 130 for the Watts Strogatz Graph and 0 to 85 for the Newman Watts Strogatz Graph.
* **Title:** "Watts Strogatz Graph" (left) and "Newman Watts Strogatz Graph" (right) positioned at the top-center of each heatmap.
### Detailed Analysis or Content Details
**Watts Strogatz Graph (Left Heatmap)**
The heatmap shows increasing values as 'n' increases, and a slight increase as 'k' increases.
* **k = 8:** Values are 15.0 (n=128), 31.0 (n=256), 63.0 (n=512), and 127.0 (n=1024).
* **k = 16:** Values are 7.0 (n=128), 15.0 (n=256), 31.0 (n=512), and 63.0 (n=1024).
* **k = 32:** Values are 3.0 (n=128), 7.0 (n=256), 15.0 (n=512), and 31.0 (n=1024).
* **k = 64:** Values are 3.0 (n=128), 7.0 (n=256), 15.0 (n=512), and 31.0 (n=1024).
**Newman Watts Strogatz Graph (Right Heatmap)**
The heatmap also shows increasing values as 'n' increases, and a slight increase as 'k' increases, but the overall values are lower than the Watts Strogatz Graph.
* **k = 8:** Values are 10.0 (n=128), 20.8 (n=256), 41.8 (n=512), and 84.5 (n=1024).
* **k = 16:** Values are 4.4 (n=128), 9.7 (n=256), 20.4 (n=512), and 41.6 (n=1024).
* **k = 32:** Values are 1.7 (n=128), 4.3 (n=256), 9.6 (n=512), and 20.4 (n=1024).
* **k = 64:** Values are 0.3 (n=128), 1.7 (n=256), 4.3 (n=512), and 9.7 (n=1024).
### Key Observations
* Both graphs exhibit a positive correlation between 'n' and the measured value. As 'n' increases, the value generally increases.
* The Watts Strogatz Graph consistently shows higher values than the Newman Watts Strogatz Graph for the same 'k' and 'n' values.
* The effect of 'k' on the value is less pronounced than the effect of 'n'. Values tend to be relatively stable across different 'k' values for a given 'n'.
* The Newman Watts Strogatz Graph has values that are much closer to zero, especially for lower values of 'n' and higher values of 'k'.
### Interpretation
These heatmaps likely represent some property of network graphs generated using the Watts-Strogatz and Newman-Watts-Strogatz models. 'k' likely represents the average degree of a node (number of connections), and 'n' likely represents the number of nodes in the network. The color intensity represents a metric related to network structure or dynamics, such as clustering coefficient, average path length, or spectral properties.
The higher values in the Watts Strogatz Graph suggest that this model produces networks with stronger structural properties (e.g., higher clustering) or more pronounced dynamics compared to the Newman Watts Strogatz model. The positive correlation between 'n' and the measured value indicates that the property being measured scales with network size. The relatively weak effect of 'k' suggests that the property is less sensitive to the average degree of nodes than to the overall network size.
The difference between the two graphs could be due to the specific algorithms used to generate them, or the parameters used in the algorithms. The Newman Watts Strogatz model may be designed to produce networks with more sparse connections or different topological characteristics. Further investigation would be needed to determine the exact meaning of the measured value and the implications of these differences.