TECHNICAL ASSET FINGERPRINT
c94dc886ac008abe369ce944
Click to view fullscreen
Press ESC or click to close
FOUND IN PAPERS
EXPERT: healer-alpha-free VERSION 1
RUNTIME: free/openrouter/healer-alpha
INTEL_VERIFIED
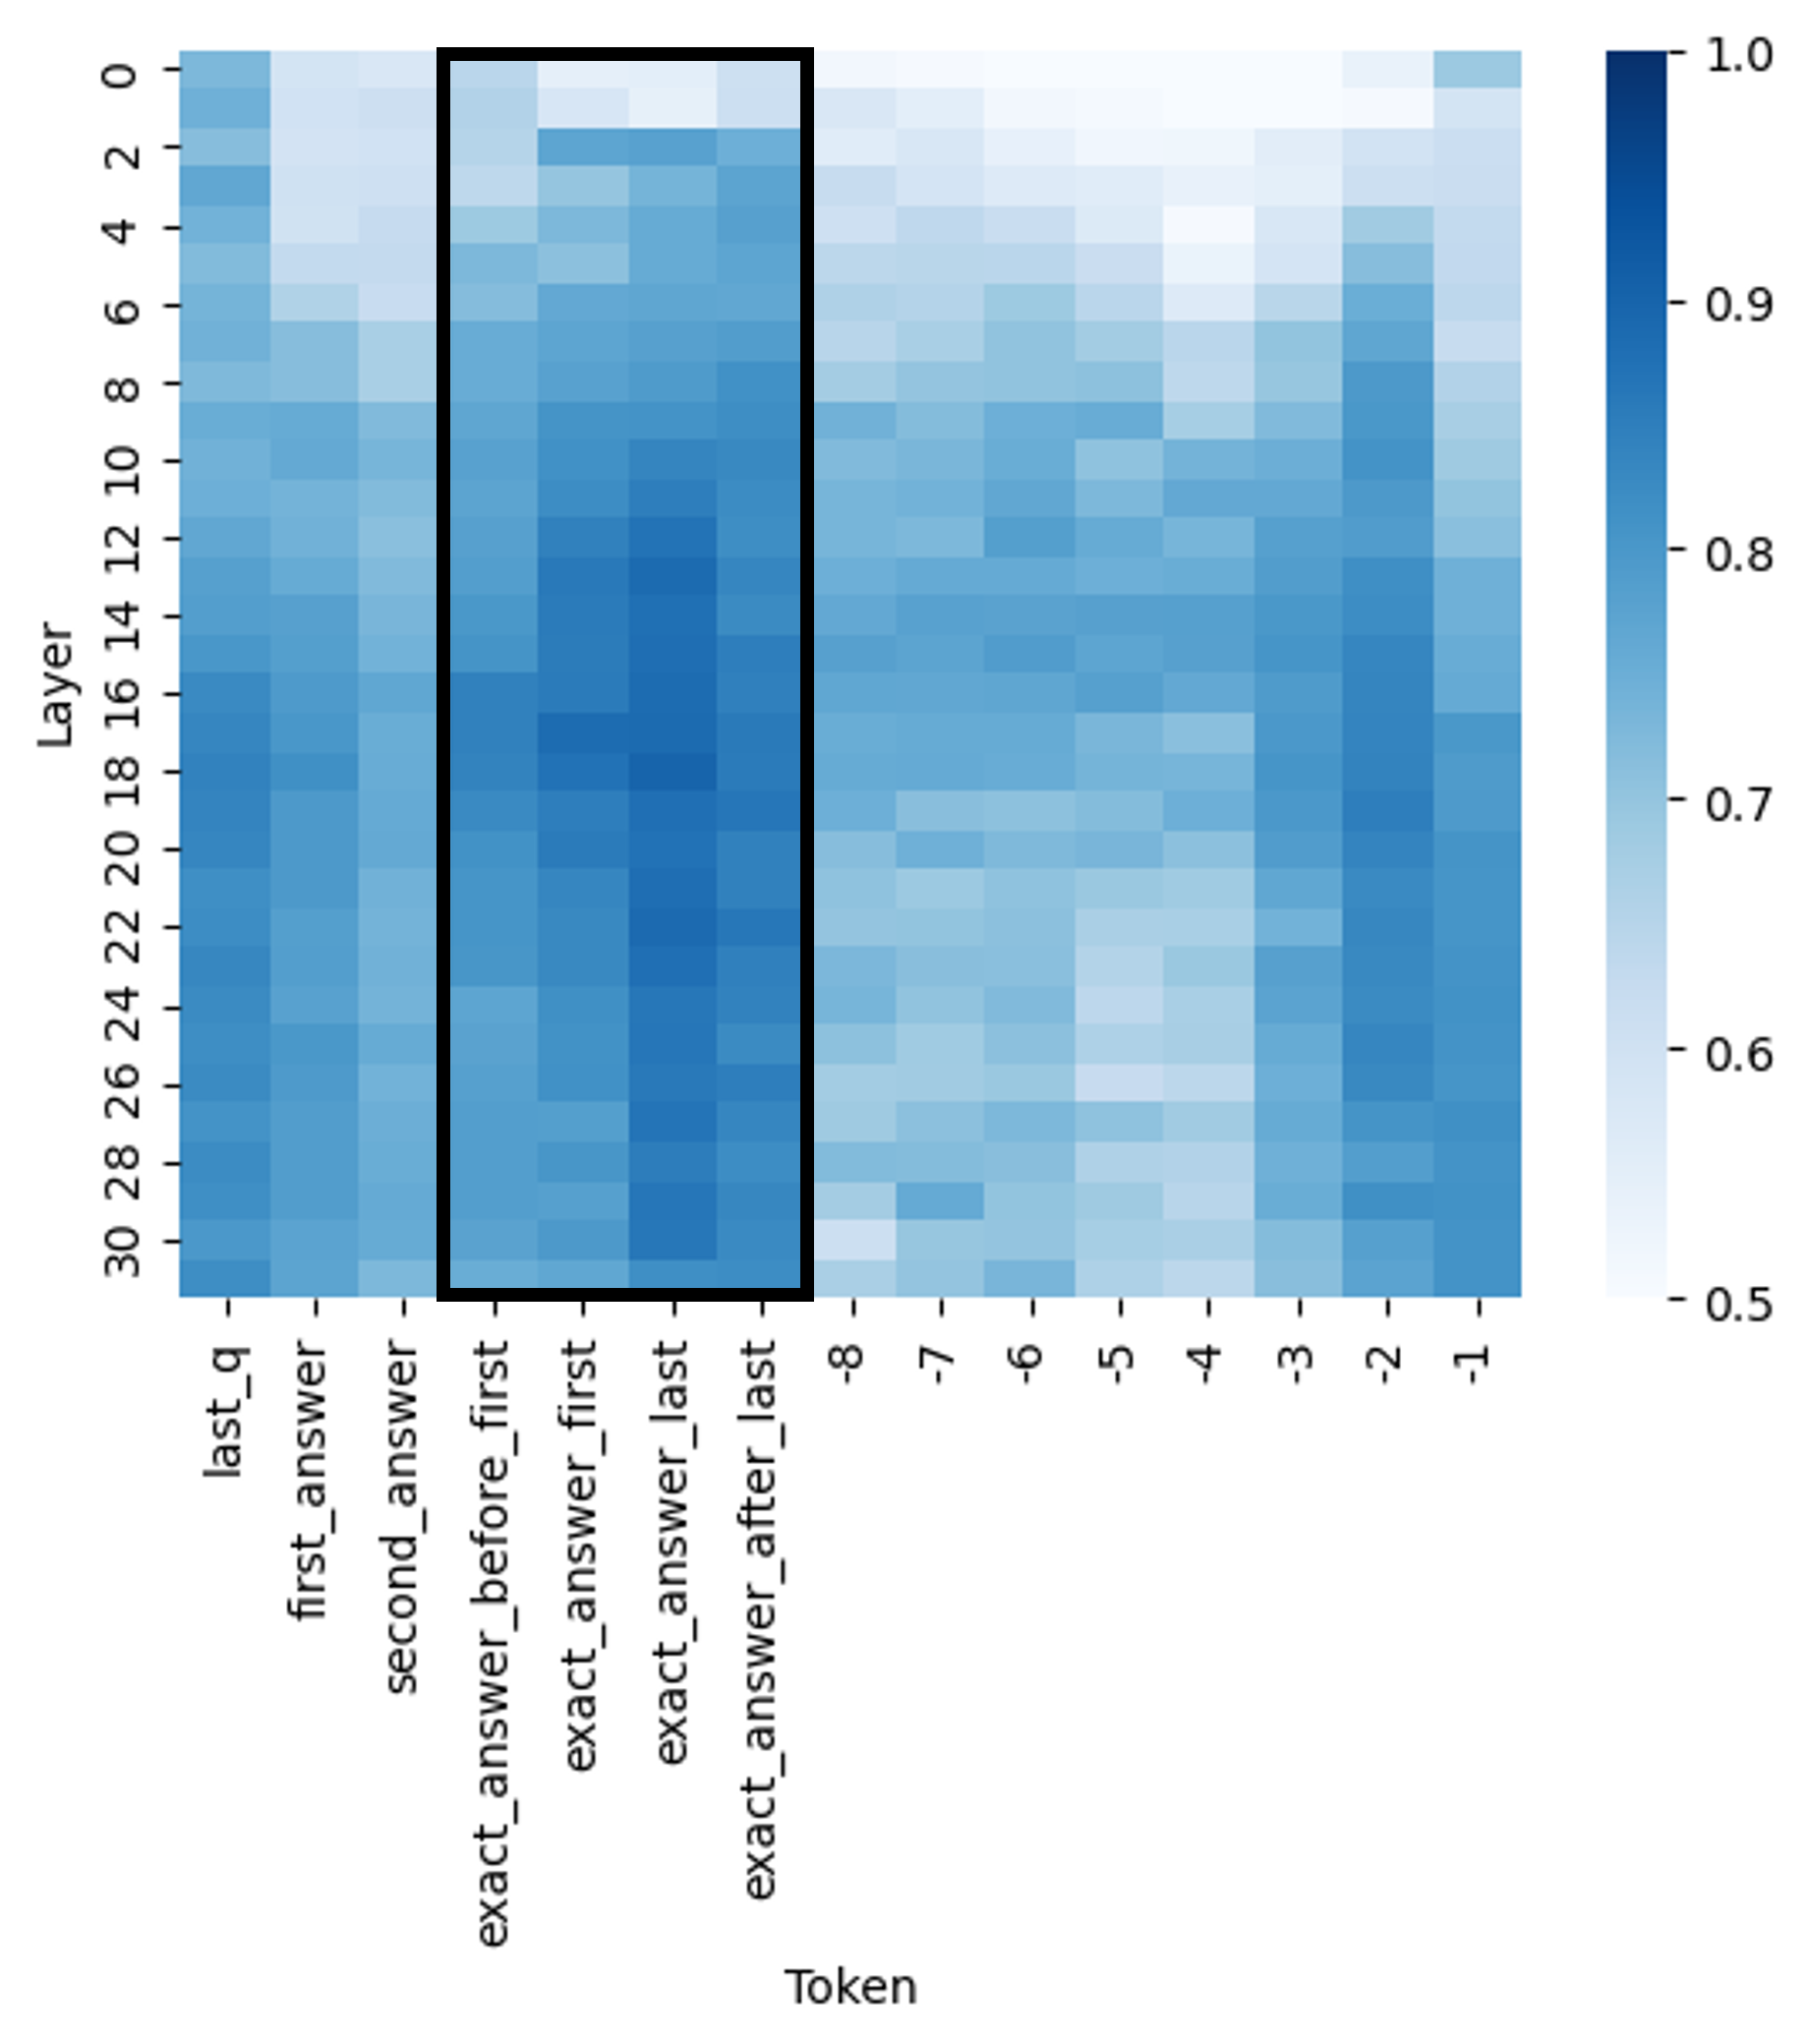
## Heatmap: Layer-wise Token Activation/Attention Pattern
### Overview
The image is a heatmap visualization, likely representing activation strengths, attention weights, or some form of importance score across different layers of a neural network model for specific tokens in a sequence. The data is presented as a grid where color intensity corresponds to a numerical value.
### Components/Axes
* **Chart Type:** Heatmap.
* **Y-Axis (Vertical):** Labeled **"Layer"**. It represents the depth or layer index within a model, numbered from **0** at the top to **30** at the bottom, with tick marks at every even number (0, 2, 4, ..., 30).
* **X-Axis (Horizontal):** Labeled **"Token"**. It lists specific token identifiers or categories. From left to right, the labels are:
1. `last_q`
2. `first_answer`
3. `second_answer`
4. `exact_answer_before_first` (Start of highlighted region)
5. `exact_answer_first`
6. `exact_answer_last`
7. `exact_answer_after_last` (End of highlighted region)
8. `-8`
9. `-7`
10. `-6`
11. `-5`
12. `-4`
13. `-3`
14. `-2`
15. `-1`
* **Color Scale/Legend:** Located on the **right side** of the chart. It is a vertical color bar mapping color to a numerical value, ranging from **0.5** (lightest blue/white) at the bottom to **1.0** (darkest blue) at the top. The scale has major ticks at 0.5, 0.6, 0.7, 0.8, 0.9, and 1.0.
* **Highlighted Region:** A thick black rectangular box is drawn around the four central token columns: `exact_answer_before_first`, `exact_answer_first`, `exact_answer_last`, and `exact_answer_after_last`. This box spans from the top (Layer 0) to the bottom (Layer 30) of the heatmap.
### Detailed Analysis
The heatmap displays a matrix of values where each cell's color corresponds to the scale on the right. Darker blue indicates a higher value (closer to 1.0), while lighter blue/white indicates a lower value (closer to 0.5).
**Trend Verification & Data Point Analysis:**
1. **Highlighted "exact_answer_*" Tokens (Center-Left):**
* **Trend:** This group shows the **strongest and most consistent high values** across the majority of layers.
* **Details:** From approximately **Layer 10 downwards**, these four columns are predominantly dark blue, indicating values consistently in the **0.85 - 1.0** range. The intensity appears highest in the middle layers (roughly 12-24). In the very top layers (0-6), the values are more moderate (light to medium blue, ~0.6-0.8).
2. **Initial Tokens (`last_q`, `first_answer`, `second_answer`) (Far Left):**
* **Trend:** These show **moderate to high values**, but with more variability and generally less intensity than the highlighted group.
* **Details:** `last_q` and `first_answer` have a mix of medium and dark blue cells, with values often in the **0.7 - 0.9** range, especially in the middle to lower layers. `second_answer` appears slightly lighter on average than the first two.
3. **Numerical Tokens (`-8` to `-1`) (Right Side):**
* **Trend:** These tokens exhibit the **lowest values** on average, with a clear gradient.
* **Details:** The leftmost numerical token (`-8`) is the lightest, with many cells in the **0.5 - 0.7** range. Moving right towards `-1`, the colors gradually darken, indicating a slight increase in value. The token `-1` has the highest values in this group, with some cells reaching medium blue (~0.8) in the lower layers. The top layers (0-8) for all numerical tokens are very light.
4. **Layer-wise Pattern (Vertical Trend):**
* **Trend:** There is a general trend of **increasing values from top to bottom** (from Layer 0 to Layer 30) for most tokens.
* **Details:** The top 8-10 layers are noticeably lighter across the entire chart. The middle and lower layers (10-30) contain the darkest blue cells, suggesting that the measured property (e.g., attention, activation) becomes more pronounced or focused in deeper parts of the model.
### Key Observations
* **Primary Outlier Group:** The four tokens inside the black box (`exact_answer_*`) are clear outliers, demonstrating significantly higher and more sustained values across layers compared to all other tokens.
* **Secondary Pattern:** The numerical tokens (`-8` to `-1`) form a distinct group with lower values, showing an internal gradient where tokens closer to `-1` have slightly higher values.
* **Layer Depth Correlation:** Deeper layers (higher layer numbers) generally show stronger signals (darker colors) than shallower layers for the same token.
* **Spatial Grounding:** The legend is positioned to the right of the main grid. The black highlight box is centered horizontally on the four "exact_answer" columns and spans the full vertical height of the plot area.
### Interpretation
This heatmap likely visualizes the internal state of a transformer-based language model during a specific task, such as question-answering. The "Token" axis represents different positions or types of tokens in the input/output sequence.
* **What the data suggests:** The model allocates significantly more "attention" or generates stronger activations for tokens directly related to the **exact answer** (`exact_answer_*` group). This indicates these tokens are critically important for the model's processing or output generation at most depths.
* **Relationship between elements:** The contrast between the high-value `exact_answer_*` tokens and the lower-value numerical tokens (which may represent positional embeddings or less critical context) highlights a **focal point** in the model's computation. The model appears to "pay attention" most to the precise answer span.
* **Notable trends:** The increase in value strength with layer depth is a common pattern in deep networks, where higher-level, more abstract features are built in deeper layers. The gradient within the numerical tokens (`-8` to `-1`) might reflect a positional bias, where tokens closer to the end of a sequence (or a reference point) are slightly more salient.
* **Underlying mechanism:** The black box emphasizes that the analysis is specifically focused on how the model treats the exact answer span compared to other question (`last_q`) and answer (`first_answer`, `second_answer`) tokens, as well as generic positional markers. The data strongly supports the hypothesis that the model's internal representations are highly tuned to the exact answer location.
DECODING INTELLIGENCE...