## Diagram: Causal Diagram & Scatter Plot - Fairness Evaluation
### Overview
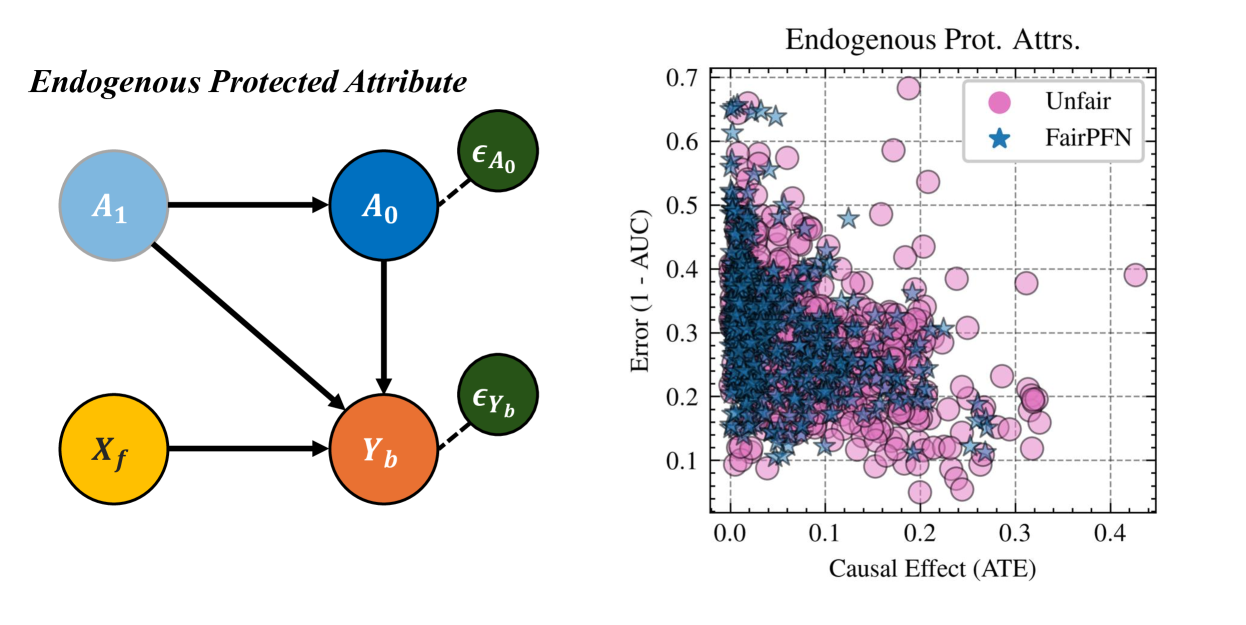
The image presents two distinct but related elements: a causal diagram illustrating the relationship between protected attributes, features, and outcomes, and a scatter plot comparing the performance of "Unfair" and "FairPFN" models based on causal effect and error.
### Components/Axes
**Causal Diagram:**
* **Nodes:** A<sub>1</sub> (light blue), A<sub>0</sub> (blue), X<sub>f</sub> (yellow), Y<sub>b</sub> (orange).
* **Edges:** Arrows indicating causal relationships.
* **Error Terms:** ε<sub>A0</sub>, ε<sub>Yb</sub> (text labels near nodes A<sub>0</sub> and Y<sub>b</sub> respectively).
* **Title:** "Endogenous Protected Attribute" (top-left).
**Scatter Plot:**
* **X-axis:** "Causal Effect (ATE)" ranging from approximately 0.0 to 0.4.
* **Y-axis:** "Error (1 - AUC)" ranging from approximately 0.05 to 0.7.
* **Legend:**
* "Unfair" (pink circles)
* "FairPFN" (blue stars)
* **Title:** "Endogenous Prot. Attrs." (top-center).
* **Grid:** A light gray grid is present in the background.
### Detailed Analysis or Content Details
**Causal Diagram:**
The diagram shows A<sub>1</sub> influencing A<sub>0</sub>, and X<sub>f</sub> influencing Y<sub>b</sub>. Both A<sub>0</sub> and X<sub>f</sub> influence Y<sub>b</sub>. The error terms ε<sub>A0</sub> and ε<sub>Yb</sub> represent unmodeled influences on A<sub>0</sub> and Y<sub>b</sub>, respectively.
**Scatter Plot:**
The scatter plot displays the relationship between Causal Effect (ATE) and Error (1 - AUC) for two model types.
* **Unfair (Pink Circles):** The pink circles are densely clustered in the top-left corner, with a general downward trend as the Causal Effect increases.
* Approximately 20-30% of the points have a Causal Effect between 0.0 and 0.1, with Error values ranging from 0.3 to 0.6.
* As the Causal Effect increases to around 0.2, the Error generally decreases, with values ranging from 0.15 to 0.4.
* At a Causal Effect of approximately 0.3, the Error values are mostly below 0.2.
* There are a few outliers with high Error values (above 0.5) even at low Causal Effect values.
* **FairPFN (Blue Stars):** The blue stars are more dispersed than the pink circles.
* The stars generally exhibit lower Error values for a given Causal Effect compared to the pink circles.
* Approximately 10-15 stars have a Causal Effect between 0.0 and 0.1, with Error values ranging from 0.1 to 0.3.
* As the Causal Effect increases to around 0.2, the Error values are generally below 0.2.
* At a Causal Effect of approximately 0.3, the Error values are mostly below 0.1.
* There are a few outliers with higher Error values (around 0.4) at higher Causal Effect values.
### Key Observations
* The "FairPFN" model consistently demonstrates lower Error values for a given Causal Effect compared to the "Unfair" model.
* The "Unfair" model exhibits a strong negative correlation between Causal Effect and Error, suggesting that increasing the Causal Effect leads to a reduction in Error.
* Both models have outliers, indicating that there are instances where their performance deviates significantly from the general trend.
* The scatter plot suggests a trade-off between Causal Effect and Error, with the "FairPFN" model offering a better balance between the two.
### Interpretation
The causal diagram illustrates a scenario where a protected attribute (A<sub>1</sub>) influences an observed attribute (A<sub>0</sub>), which in turn affects the outcome (Y<sub>b</sub>) along with other features (X<sub>f</sub>). The error terms indicate that the model doesn't capture all the factors influencing these variables. This setup is prone to unfairness if the model doesn't account for the causal relationships.
The scatter plot demonstrates the effectiveness of the "FairPFN" model in mitigating unfairness. By achieving lower Error values for a given Causal Effect, the "FairPFN" model suggests a better trade-off between predictive accuracy and fairness. The "Unfair" model, while potentially achieving lower Error values at higher Causal Effects, may be doing so at the cost of exacerbating unfairness. The outliers in both models suggest that there are specific instances where the models struggle to generalize, potentially due to unmodeled factors or data limitations.
The diagram and plot together suggest that incorporating causal reasoning into model design (as done in FairPFN) can lead to fairer and more robust predictions, especially in scenarios where protected attributes have an endogenous influence on the outcome. The plot provides empirical evidence supporting the claim that FairPFN reduces error while maintaining a reasonable causal effect.